Visual Asset Strategic Tools. Capture Building Information for Building Life Management. Open Source/Low Cost Technology Solutions for you to control your buildings
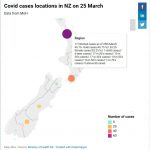
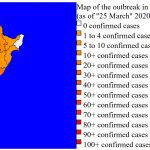
The Ministry of Health(MoH) have posted the original dataset on a different web page of each case and which District Health Board (DHB) they are under. The data can be found here. Instead of by region, its mapped to the District Health Board Regions. So the original map I was using in this post is
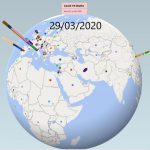
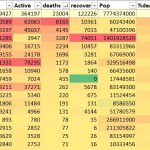
I suppose I could use PowerBI but I’ll srick with Excel for the moment. PowerBI has the dashboard but I did find it slow, its speed may have improved but that is for testing another day. I’m using the John Hopkins Github repository of Data which is updated daily and what they use for their
At the end of the last post I’d found that the original NZ regional dataset had changed. I was also finding it slow working in Google Sheets as the interwongle seems to be slow with so much demand. So I decided that I’d start working locally. My current process is to get the data, manipulate
At the end of the fist part I’d got some data to play with from a couple of sources, cleaned it up, got some data to make paths to create a map and coloured map in by region based on covid cases. This was done using Excel, Notepad++ and displayed in browser. I was just
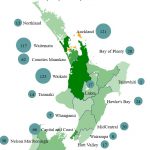
I’m thinking of trying to do an NZ map of regions where cases are. I’m using link to Wikipedia 2020 coronavirus pandemic in New Zealand page for data on region data. I have been looking for polylines for these regions and also centroids for region polylines. No luck so far with centroids but I got
I really enjoy the curated maps that Keir Clark presents on his Maps Mania website. I get them through my RSS feed and there are some pretty interesting ones. He had this article Sub Francisco about Andrei Kashcha’s City Roads rendering in brouser of a selected city roadways. After selecting your city of choice you
I have played with Power BI and Data Studio (DS) is Google’s equivalent, and its Free. Since I’ve been playing with GlideApps I have been working in the Google Docs environment with Sheets and Google App Scripts (GAS) and find the Google environment is versatile and has lots of features. An extension of learning to
I was looking at the GlideApps showcase and the Bogdan Popa created a News App. In it he uses IMPORTXML in Google Sheets to pull in web data that he filters to different tables. A nice app. I started thinking about what other import formulas does Google Sheets have, I know it has GOOGLEFINANCE for
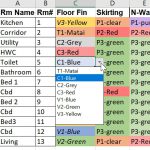
The first process I did Architectural Colour Schedule in Excel used VLookup() to lookup a table on a separate sheet, but it did not show you the choice of selections. This time I want to be able, when looking up a room finish, to see what the selections are, so that I can choose an
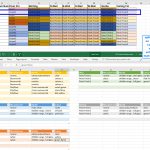
The last post I tried to use AirTable to create a Colour Schedule from a Revit export. Thinking I could use the Database to cross reference items in the room such as doors/windows etc to be able to pull those in to make the colour scheme planning more comprehensive. It didn’t work. Along the way