Visual Asset Strategic Tools. Capture Building Information for Building Life Management. Open Source/Low Cost Technology Solutions for you to control your buildings
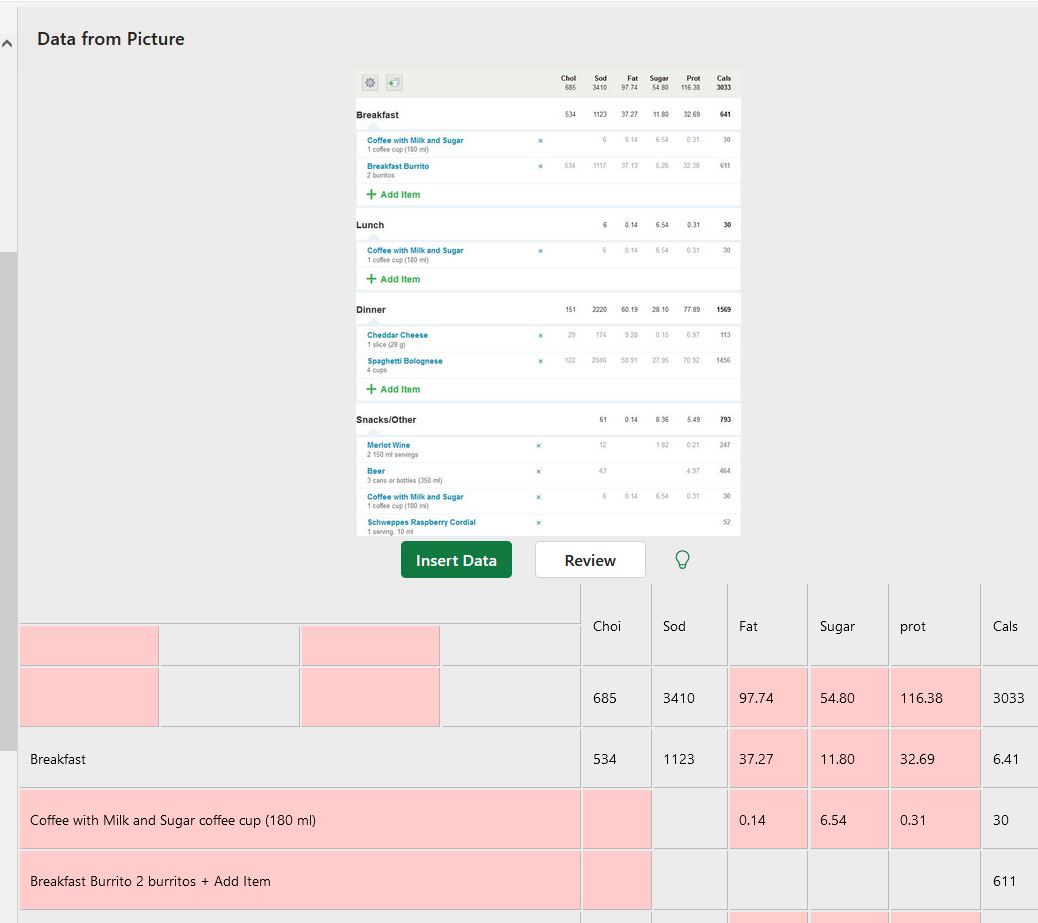
I use a lot of tabular data and have some challenging times using OCR (Optical Character Recognition) to get tabular data into a Spreadsheet format . I use Free PowerToys Text Extractor to capture information but it pastes all the text in one column.The Free Excel Insert Data from Picture feature is really helpful as
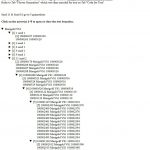
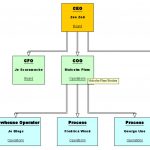
The web page for the Tree Diagram Background story My daughter is a grower and she had information on the different generations of plants she is growing. She has a spreadsheet that she uses to show different strains of plants, grown initially from seed and then cloning the plants to get the best strains. To
I was watching the vid below on AHK and barcode scanners, he tells a story, about 7.20 min in about someone who uses barcodes to record feeding times and cage numbers to speed up record keeping. I thought that would be an interesting project for learning about recording data on plants, thinking about OraPharm (My
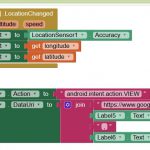
I lke GlideApps, they are cool. You can make some great apps with them. But you cannot access youtr phone’s sensors. So I thought, use App inventor to grab data from phone sensors, send it to google Sheets and then use GlideAppps to access the same google Sheets with that data to make a richer
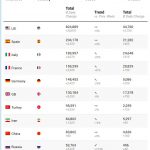
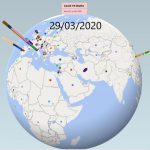
This is in fact an article How to import JSON data into Google Sheets to create a live COVID-19 chart that I came across on my RSS feed from Datawrapper. I want to follow this as it sort of comes full circle. I’d started my covid data exploration with Google Sheets and importXML() and now,
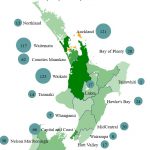
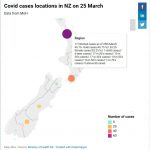
The Ministry of Health(MoH) have posted the original dataset on a different web page of each case and which District Health Board (DHB) they are under. The data can be found here. Instead of by region, its mapped to the District Health Board Regions. So the original map I was using in this post is
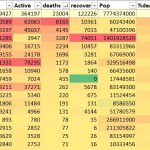
I suppose I could use PowerBI but I’ll srick with Excel for the moment. PowerBI has the dashboard but I did find it slow, its speed may have improved but that is for testing another day. I’m using the John Hopkins Github repository of Data which is updated daily and what they use for their
At the end of the last post I’d found that the original NZ regional dataset had changed. I was also finding it slow working in Google Sheets as the interwongle seems to be slow with so much demand. So I decided that I’d start working locally. My current process is to get the data, manipulate
At the end of the fist part I’d got some data to play with from a couple of sources, cleaned it up, got some data to make paths to create a map and coloured map in by region based on covid cases. This was done using Excel, Notepad++ and displayed in browser. I was just
I’ve been doing some work for my daughter on her growing business. One of the things I was trying to work out was a flow process for the organisation, from seed o delivery and items needed along the way. I started to use Bubbl.us to look at some of the flows and organizational structures and