Visual Asset Strategic Tools. Capture Building Information for Building Life Management. Open Source/Low Cost Technology Solutions for you to control your buildings
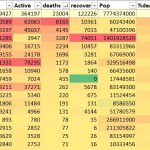
At the end of the last post I’d found that the original NZ regional dataset had changed. I was also finding it slow working in Google Sheets as the interwongle seems to be slow with so much demand. So I decided that I’d start working locally. My current process is to get the data, manipulate
I went to a WordPress meetup and the presenter was discussing the content on your website. Why are you doing one and what are your goals. That stumped me for a while, I’ve sort of fallen in the habit of building something and my previous goals which were not met have fallen by the wayside.
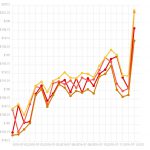
After Stock Data 2. Graph in Excel from Web and Graph from API to web page I had got the Excel Graph working but had fudged the API to Graph process. So, back to the interwongle, and this time I asked Mr YouTube. I got a bit of a lead on using Chartist.js to display
In the previous post “Stock Data 1. Capture via API and Excel from Web” I used Excel to grab some data from the Web & show it as a Table inside Excel. After bringing the data in I had trouble creating a chart from the Table. So, after messing around with the Charts again today
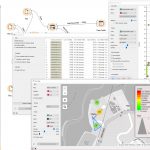
I was looking through 101-useful-websites article and came across AlternativeTo.net and used it to look up alternatives to say “Revit” and “AutoCad” and other tools I use. I then typed in KNIME which I use for data mining, data analysis and it came up with Orange as a free alternative. So I looked at some
There is an interactive tutorial here running Python. This instance is running from another website so could be slow. I found this video extremely good for setting up (I used the pip install method not anaconda) and how to use it. The Jupyter Notebook The Jupyter Notebook is an open-source web application that allows you
Hi All, Forum tab next to Home on menu bar. Or HERE I have noted that there seems to be quite a bit of interest from you out there on my openMAINT setup and configuration blogs. Obviously you are interested in the product and interested in getting instances of your own up and running. I
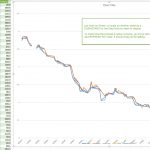
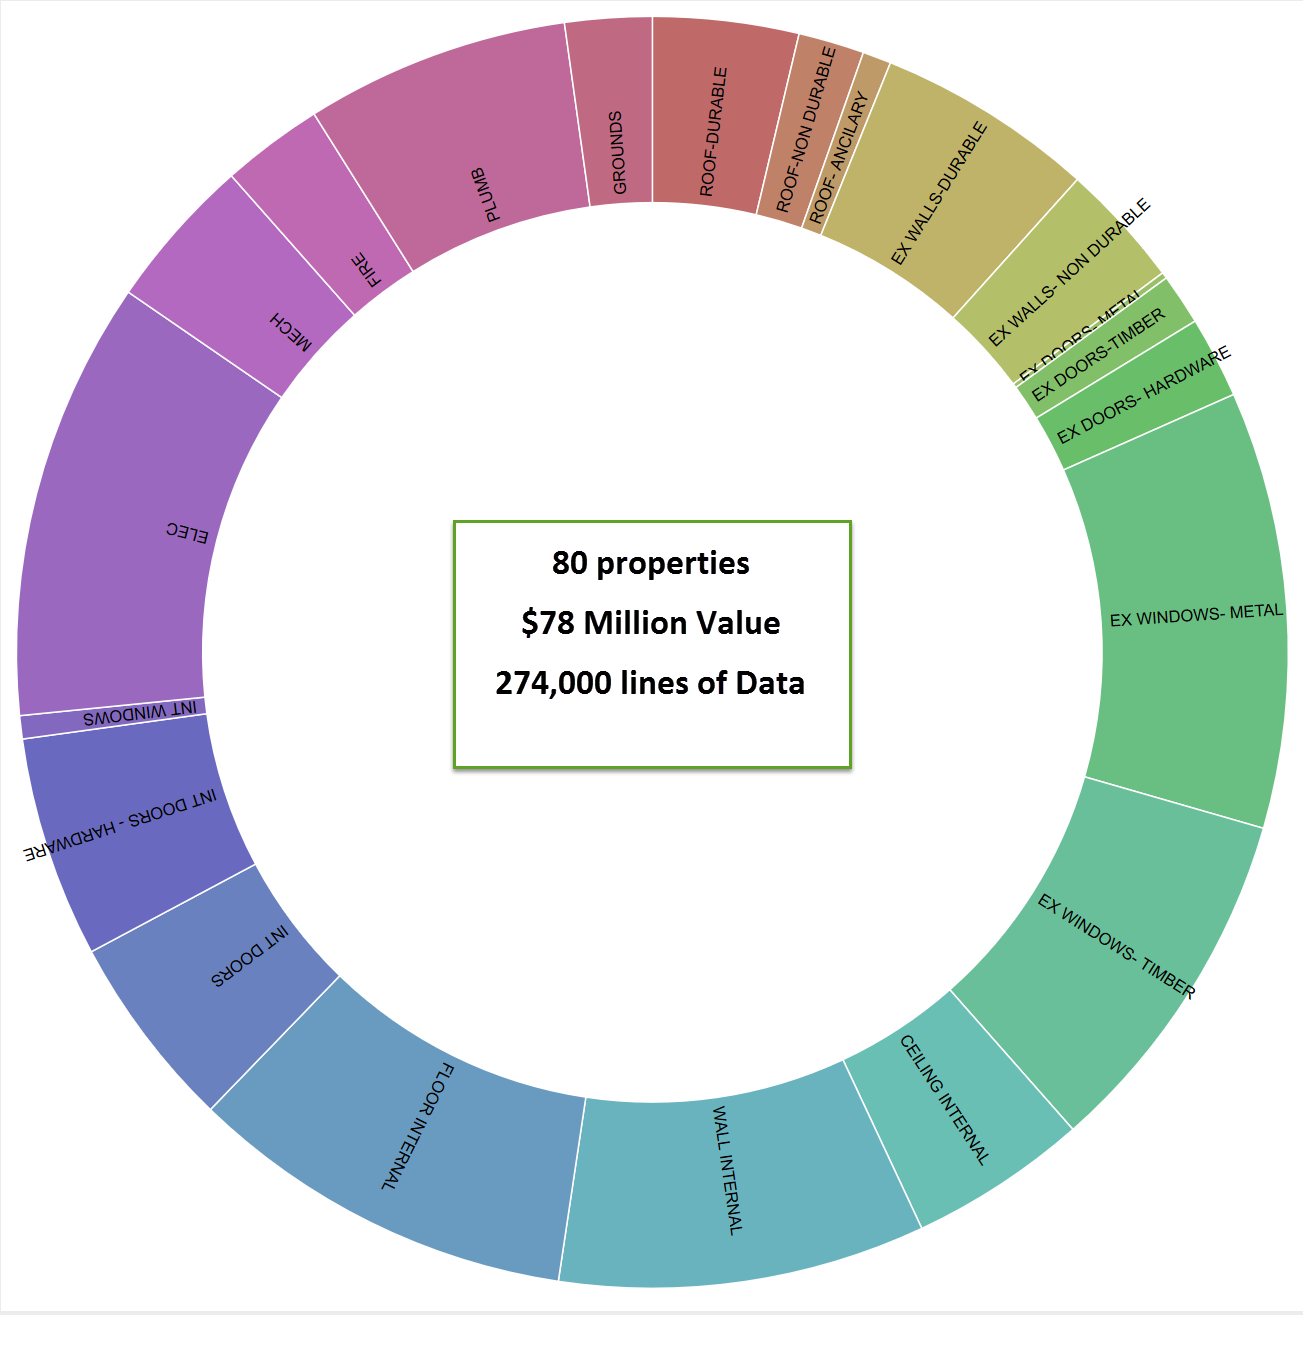
This analysis is based on 274,000 rows of data regarding social housing survey of interior and exterior inspections. It has been filtered for building fabric, services and joinery have been excluded at the beginning. It is a bit of a haphazard blog. I used Knime to filter out the data and slowly filtered building data