Visual Asset Strategic Tools. Capture Building Information for Building Life Management. Open Source/Low Cost Technology Solutions for you to control your buildings
My daughters business regarding plants got me into exploring home automation. I bought a few devices and started testing them at home. I just went to the local shops and bought a few devices. Initially I was quite impressed with how easy they were to setup (proviso here on wifi network and bands , 2.4GHz
In a previous video , Python create Daily Planets Sky Map for Epheremis, Email & Automate –(https://www.youtube.com/watch?v=1LgB5kyCA08) I use python to attach created pdf document and attach to email and send to myself and others. Email sent to me with CSV attachment to Hotmail account In this video I’m sent a CSV file with meter
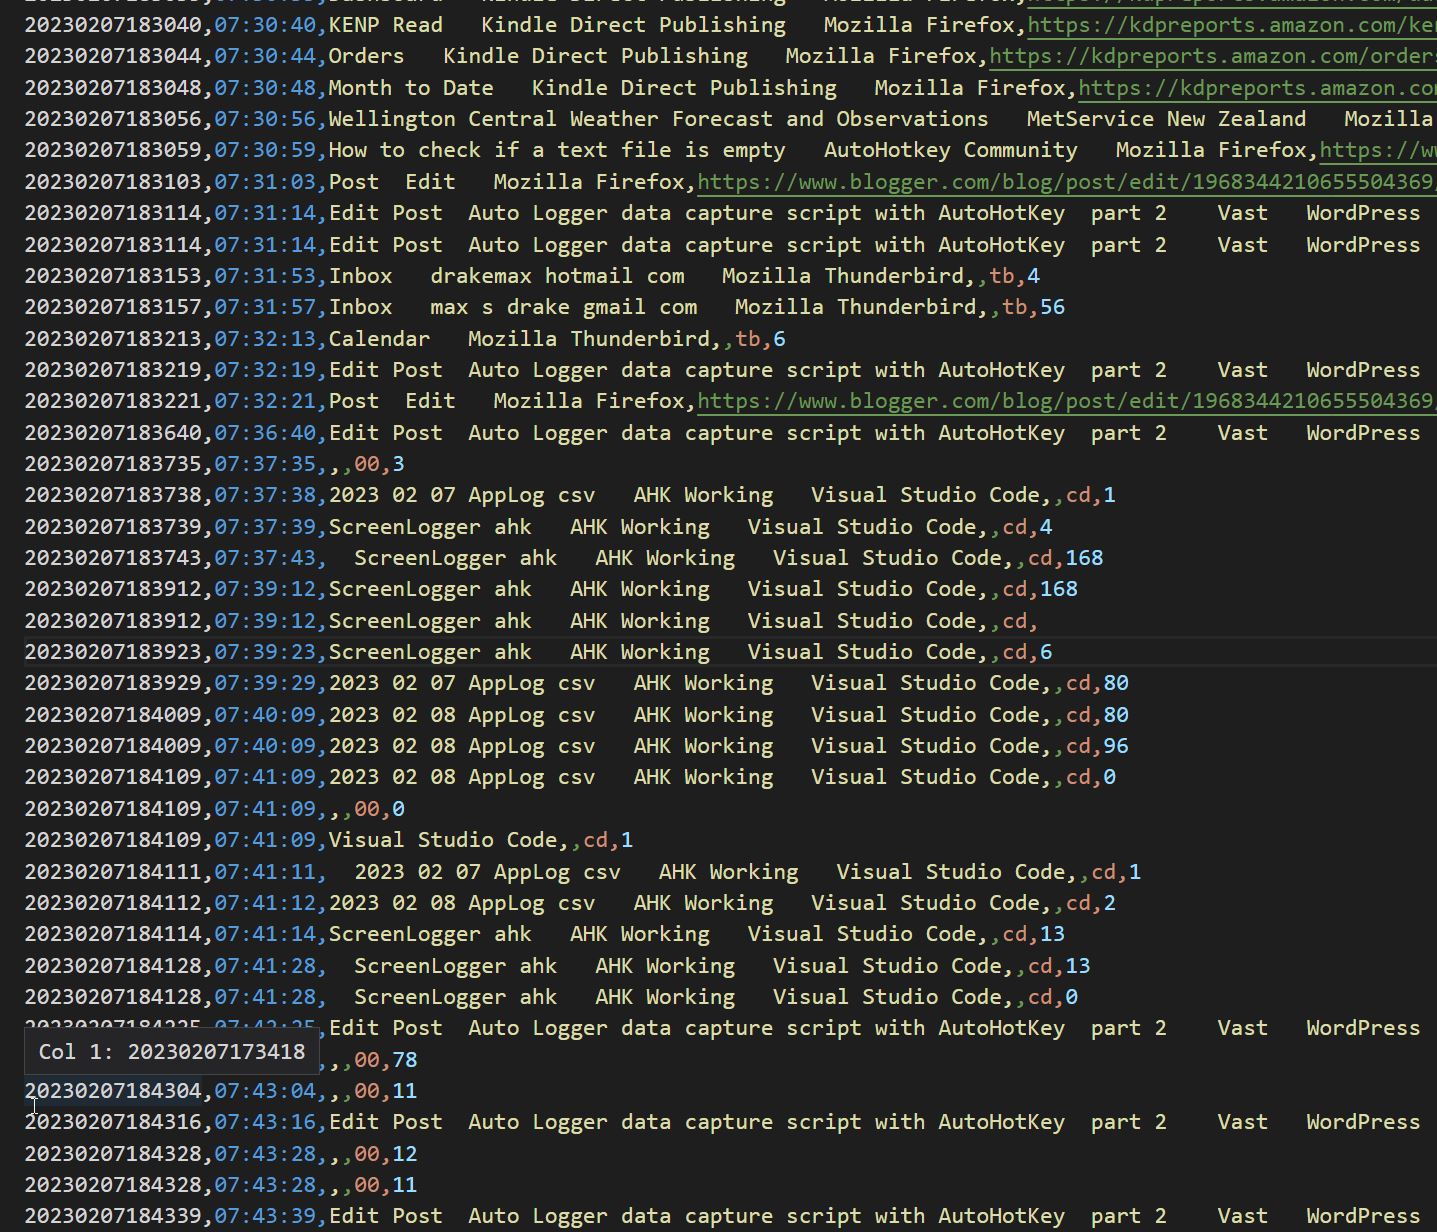
In Auto Logger and timesheet exploration with AutoHotKey and Python Part 1 I gave an overview of the project, in this article I want to go into the development of the background process of auto-logging computer activity on the PC. My initial start, as mentioned in the previous article was to start with the code
just reviewed my website and see that I have not posted anything since November. A change of habits and a focus on some different projects. The change of habit is in using Obsidian for most of my note taking of late. I find it a very handy tool to chart progress on projects I’m working
After getting into AHK I started to explore further. Auto close down script with hotkey One question I asked was can you close down a running script with a hotkey?, so a built in close command, and you can, a very interesting post on Stack Overflow “How do I stop an active AutoHotkey script?“. I’ve
This is based on the video by Brad Traversy below: Just as a tag, there is a wiki api page here. I’m putting it here instead of previous article because the website is going extremely slowly. I liked the idea of this and the beginning part when he was pulling the whole page worked fine.
This is in fact an article How to import JSON data into Google Sheets to create a live COVID-19 chart that I came across on my RSS feed from Datawrapper. I want to follow this as it sort of comes full circle. I’d started my covid data exploration with Google Sheets and importXML() and now,
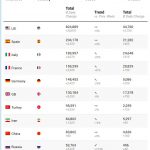
After pulling the data from an API ans displaying it in a web page Chart, and developing a crude selection list for different countries and dates, I started to think about creating my own API as a project. As I looked around for data I came across Dixon Cheng’s Github repository of Covid-19 data scraped
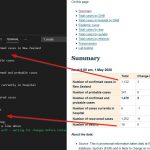
The Ministry of Health(MoH) have posted the original dataset on a different web page of each case and which District Health Board (DHB) they are under. The data can be found here. Instead of by region, its mapped to the District Health Board Regions. So the original map I was using in this post is
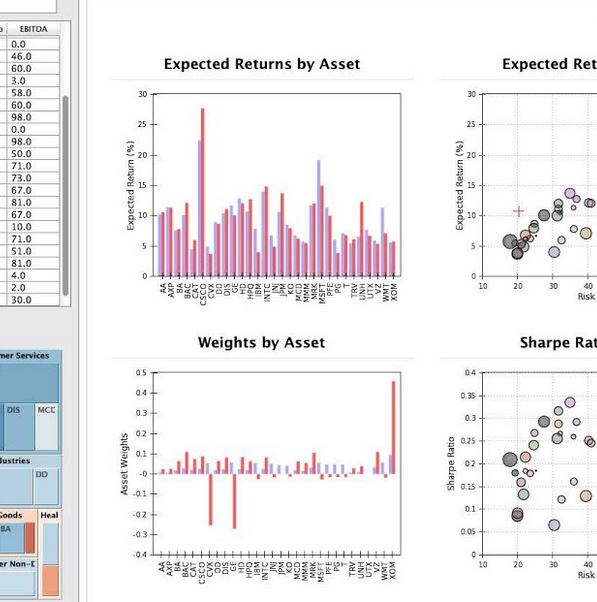
I suppose I could use PowerBI but I’ll srick with Excel for the moment. PowerBI has the dashboard but I did find it slow, its speed may have improved but that is for testing another day. I’m using the John Hopkins Github repository of Data which is updated daily and what they use for their