Covid by region NZ -map representation- Part 2
At the end of the fist part I’d got some data to play with from a couple of sources, cleaned it up, got some data to make paths to create a map and coloured map in by region based on covid cases. This was done using Excel, Notepad++ and displayed in browser. I was just starting to look at labels/legends for the map.
Using Datawrapper
I have played with online maps before, but they were pretty limited as far as NZ went, like Google Charts ap only showing Oceania, not NZ. I decided to have another look at Datwrapper as I hadn’t played with it for a couple of years and it may have updated. It has, there is a NZ regional map, so I’d thought I’d play with that to see if I could progress with the data more readily.
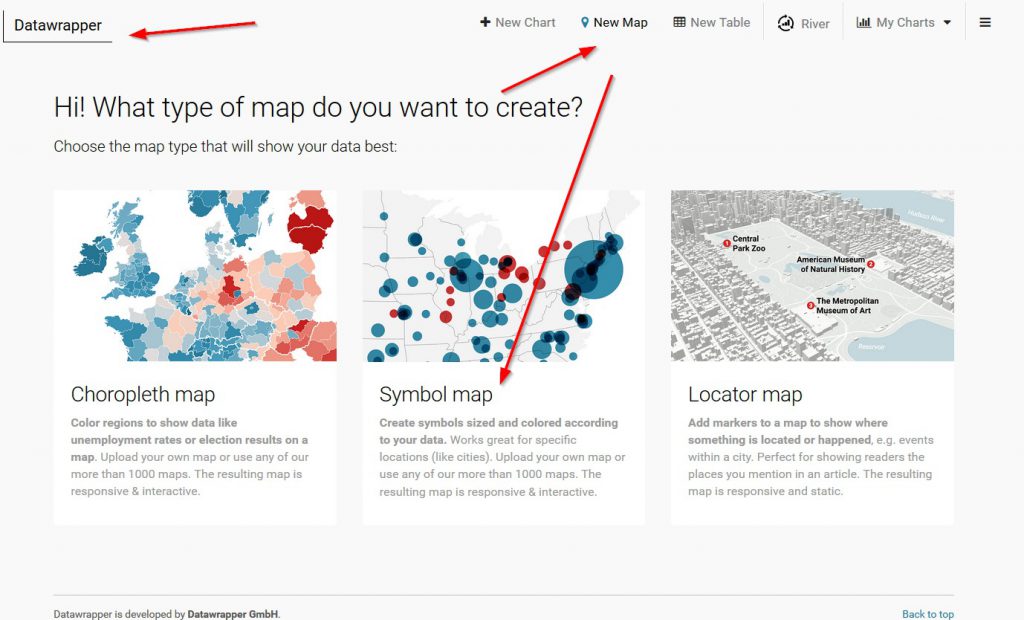
I chose a symbol map type (will definitely have to play with the locator map, that looks cool)
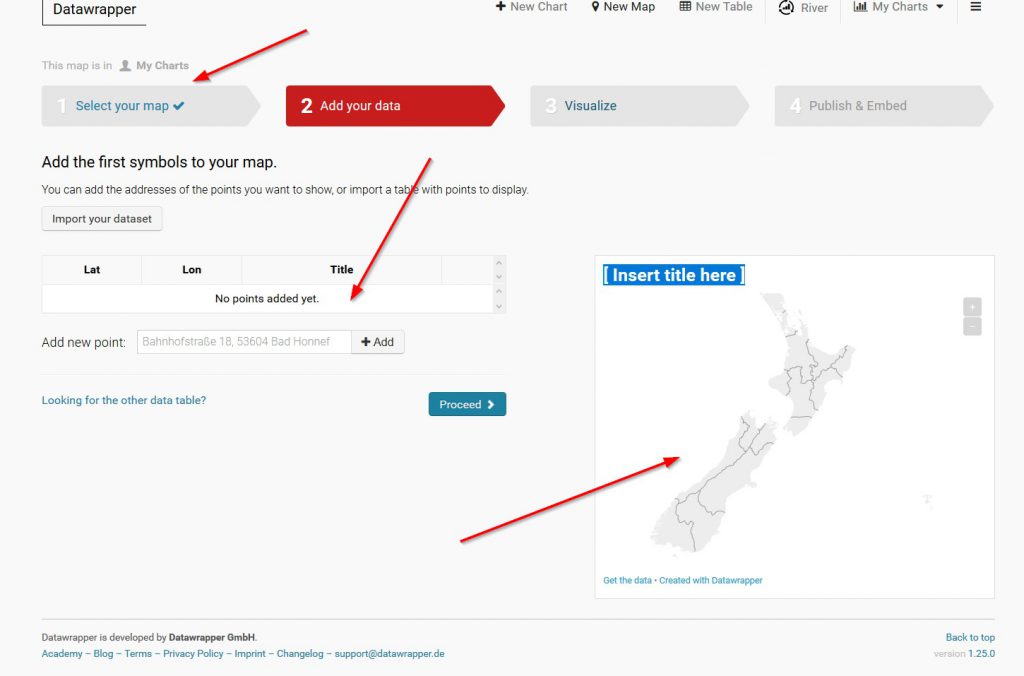
Then after selecting NZ regional map I was asked for data. Since it is symbol I need a point to locate the data. So I went into…
Google Earth for points within boundaries
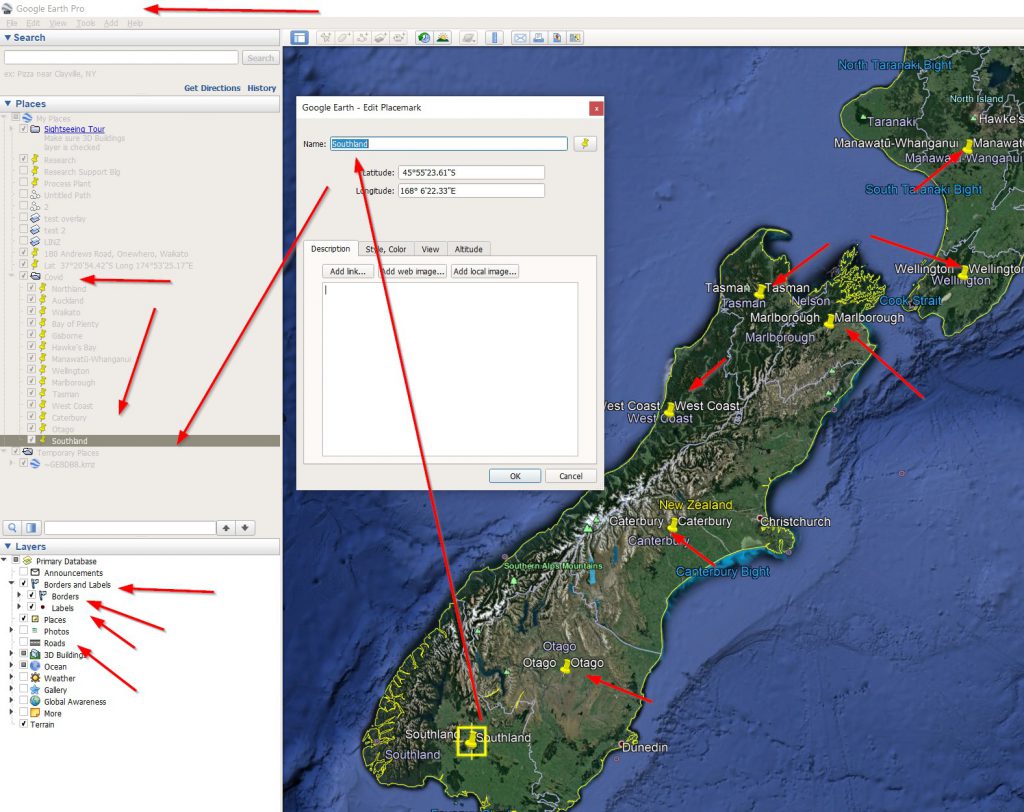
In Google Earth I turned on borders and turned off roads, then put a placemark in the different regions with a title . I made a new folder to store all the placemarks in. I wanted to get that data to use in sheets, a Lat/Long & Title. I knew I could go into individual placemarks and cut/paste data but I was sure there is an easier way to export multiple points from Google Earth.
You can select afolder and exported to a KMZ file. Unfortunately that is compiled, so I needed a mthod to extract the data from KMZ to another format. I forund this web page Google Earth placemarks to Excel. That converted the KMZ file to a CSV file that I could open in Sheets or notepad. This process is good, because if I need to move one pin because it is not in a good position its easy to do and easy to update. Here is the list of pin locations. At least this is a start. I had issues trying to find centroids of regions but this is far better as you can adjust as you need for aesthetic presentation purposes
“Name”,”Description”,”Latitude”,”Longitude”
Northland,,-35.55752897288653,173.9706962308053
Auckland,,-36.88446458503898,174.7593660699155
Waikato,,-38.08646123851568,175.5620179677784
Bay of Plenty,,-38.01950908158162,176.6506252739918
Gisborne,,-38.31711552776068,177.9513173813045
Hawke’s Bay,,-39.42865541307646,176.6869152144428
Manawatū-Whanganui,,-39.73098865419606,175.4555173139747
Wellington,,-41.07259426632601,175.4323683274915
Marlborough,,-41.60629728142014,173.5788158683521
Tasman,,-41.29151546136643,172.6057092903673
West Coast,,-42.51012415627857,171.3135886923324
Caterbury,,-43.71336357885355,171.3277839139198
Otago,,-45.16479441088008,169.6551727387001
Southland,,-45.92322551656932,168.1062023275522
Back to Datawrapper
I tested the above lat/Longs and they come out fine. Here is the link:
HOVER OVER SYMBOLS ON MAP TO GET METADATA, ZOOM IN AS REQUIRED
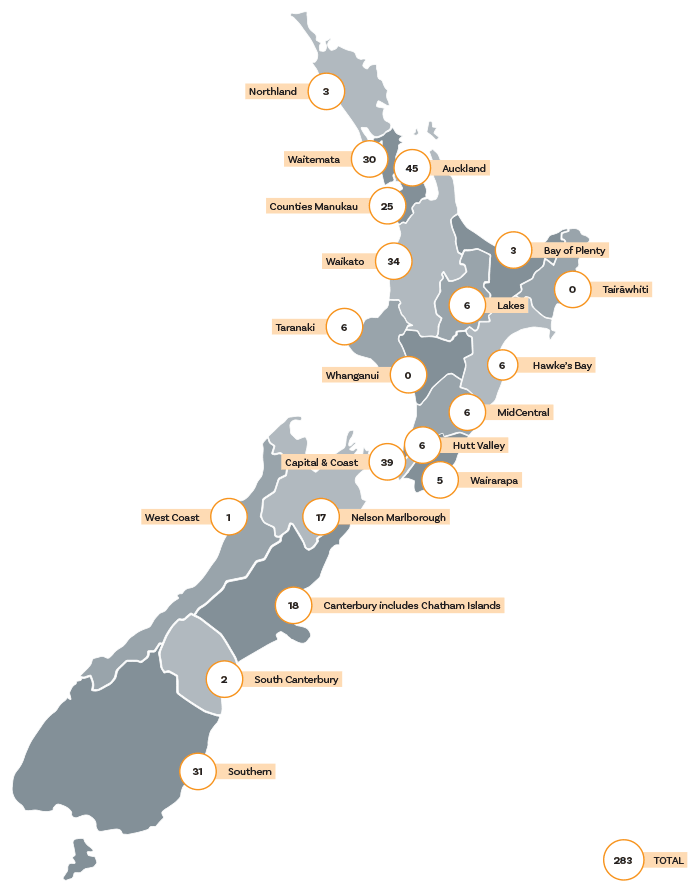
The chart is OK, but pretty basic.I can’t colour background, and the no-data columns do not show up at all (eg West Coast Region). But it does have the hover element where you can put extra data. The legend is rather general. To compensate I’m also doing a Table below so you can view the information. It is embedded in the map but people need to zoom in and hover.
So, a little bit of data manipulation to present the information in a more informative manner than how it is shown on the MoH website. I want to start going into it in a bit more detail now I have the basics setup.
Slow web may be better to work locally
I’m not sure if my Sheet is going to crash with the new importXML with new data, I’m waiting until the website updates. Updated yesterday at 2pm, so we’ll see what happens (currently not 2pm but 1pm update says cases up to 283 of confirmed and probable and also some community transmitted.
I noticed that the computer went very slow just after lunch, lots of people checking for updates. I may think of moving from Sheets to Excel so I can run locally rather than over the web. I actually use a CSV upload to Datawrapper so that works fine.
Bugger
After setting up the path, downloading the data the MoH has reconfigured it and is showing their information on a map, so much less information, more simplistic. There goes that data source. Also instead of regions its going by District Health Boards, in some ways that makes more sense.
I have the global information infor CSV that I can download from this page: https://ourworldindata.org/coronavirus-source-data so I will start playing with that. One thing I do want is to compare against country’s population. I was just starting to get NZ regional population figures (NZ Stats 2013 census) to put into the spreadsheet. Maybe I need to do this for global, although I think the files above have that information somewhere.
So this is pushing me to work offline with the data set.