Covid by region Globally -Data visualisation- Part 3
At the end of the last post I’d found that the original NZ regional dataset had changed. I was also finding it slow working in Google Sheets as the interwongle seems to be slow with so much demand. So I decided that I’d start working locally.
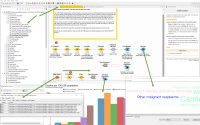
My current process is to get the data, manipulate it in spreadsheet, export to HTML file initially then to a CSV that I uploaded to Datawrapper to show on their maps, then I embedded link into website.
MS SQL database
Instead of just going to Excel, which I’ll do anyway, I’m initially going to upload into a MS SQL database and start writing queries on the data to export. Its taking me a while to set up the table and relearn SQL queries and exporting to .RPT files and then converting to TXT or CSV files for further information.
On relearning the MS SQL bits I’m starting to get other data file. The John Hopkins sources referenced at bottom of dashboard go to GITHUB and have daily data and time series HERE. So I’ve downloaded them and am going to upload to some DB tables.
I spent quite a lot of yesterday afternoon trying to import information into MS SQL database, not that successfully as I had issues with putting a primary key on the tables and date headers were going wrong. I’m going to park that for a time.
Excel
I’ve imported into Google Sheets, now I’ll try importing into Excel. Excel has a Data> from Web button, where you put in a URL and then select a table, but that didn’t work on the wiki page so it brought in all the page. I tried deleting text above and below the table but on refresh it just came back, so I linked the table to another sheet to work with the data.
The link I’m using is Current cases from Wikipedia which uses the same source as Bing Tracker.
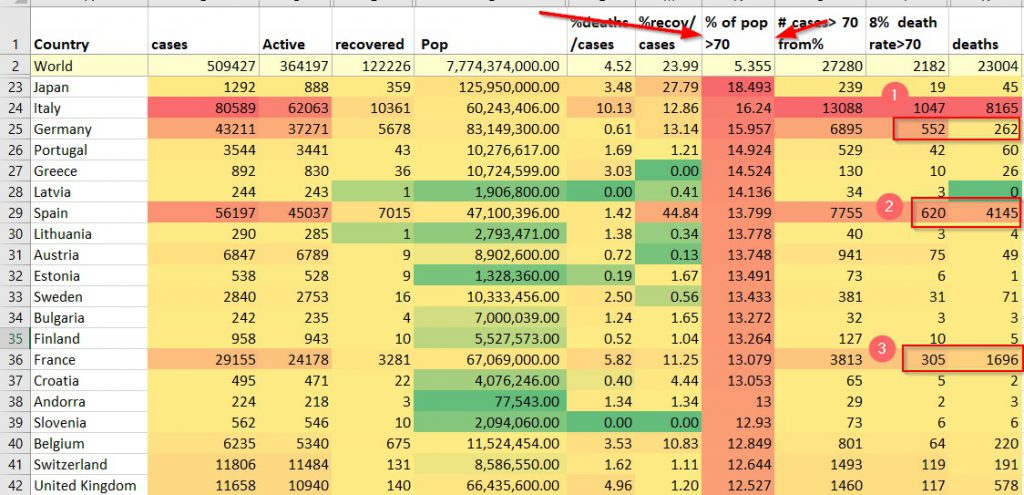
I’ve then put some percentage figures on the numbers, pulled in country populations from Wikipedia here. I’ve then done some basic conditional formatting on the columns, with World as reference at top (no conditional formatting for that otherwise it overwhelms the data) and the following info comes out, AS OF 26th March 2020. This is static data, just comparing highs/lows.
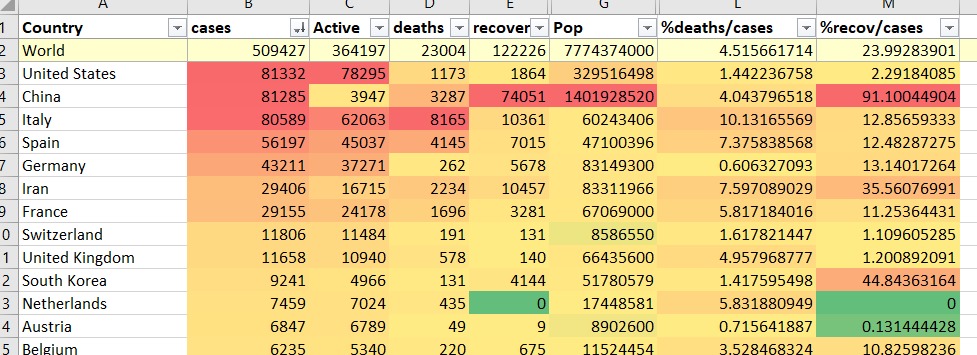
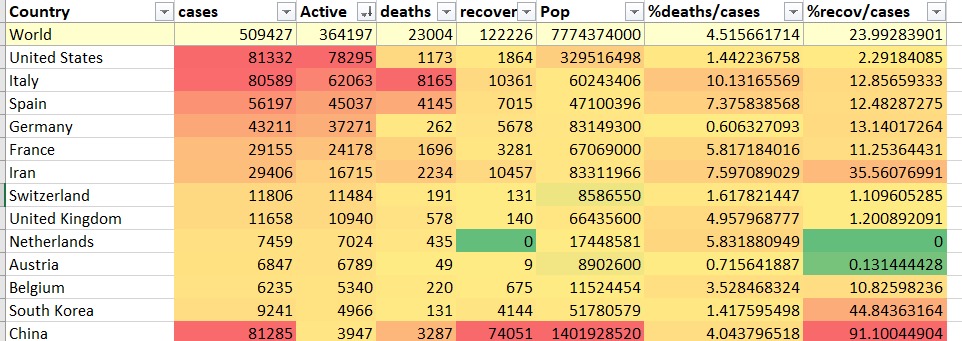
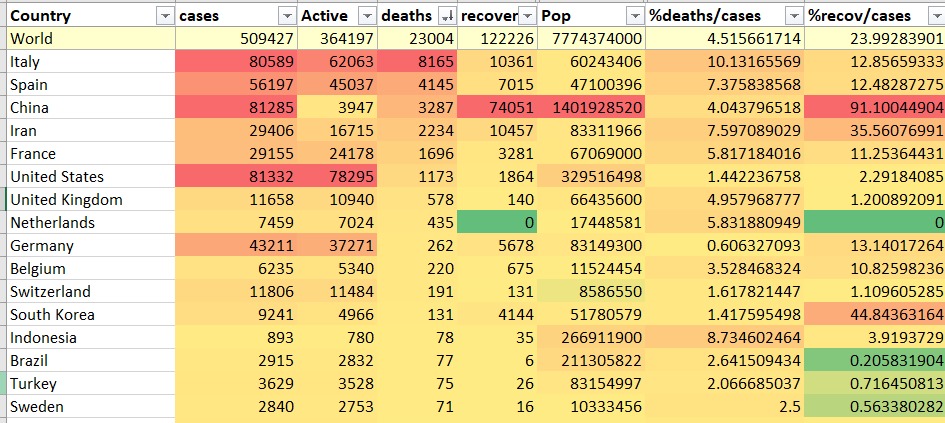
Use this chart to add countries for deaths and rates of change.

Percentage pop over 70 by country Data from here.
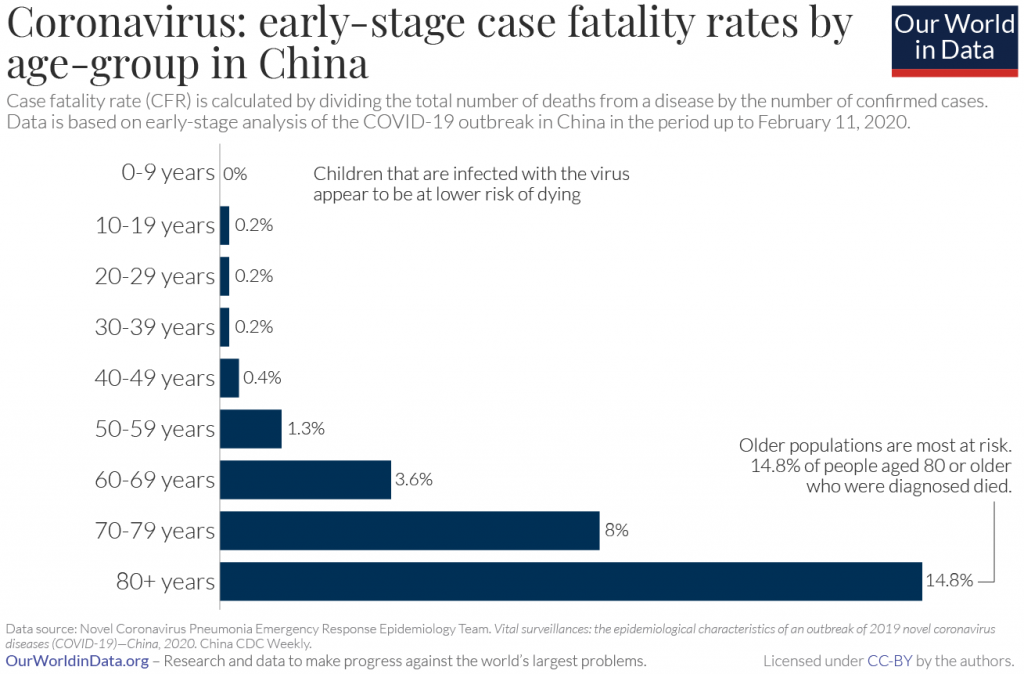
so, from above chart I’ll use 8% as likely death rate for over 70’s. A bit of a cock up linking data between sheets, on one page I had filters on, so it pulled data into the wrong Rows. OOPS!! (bring heater across to find link cell, then copy adjacent column across and use Find/Replace on Column code seems to be best way of doing this, you don’t have to mess around with aligning data on both sheets)
I want to get historic data now and see what I can do with that. There are rates of change over time to be explored.
End comment
I just refreshed the page and brought in the data for today, there were a few errors that I had to clean up, but it went pretty well. I am pulling from 3 different tables off web pages, so not too bad.