Google Sheets Google Analytics add-in to create dashboards
I was looking at the GlideApps showcase and the Bogdan Popa created a News App. In it he uses IMPORTXML in Google Sheets to pull in web data that he filters to different tables. A nice app. I started thinking about what other import formulas does Google Sheets have, I know it has GOOGLEFINANCE for share data is one & I’ve just found out about GOOGLETRANSLATE too. I still haven’t set up an app that utilises this as a formula directly, but have some ideas on a use.
I came across this article about Google Analytics Spreadsheet Add-on. This is something of an issue with me, Google Analytics has heaps of stuff in it but I never seem to get it in a format that I want.
The Sheet add in looks like a good way to set up a dashboard to display information. In the article there are 2 videos, a basic use of the tool and then a dashboard is built. Both worth watching. I will look to try and replicate the dashboard in the 2nd video and embed the data about my website on a page or post on the website.
Results- Some above
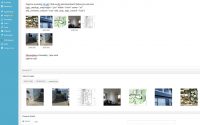
After following the tutorial video these are the charts I ended up creating. There are a couple at the front of the post as I couldn’t resist putting them in a prominent position.
I did a number of sessions chart and one for users as some users go through a lot of pages, others just view one and bounce.
Sessions/user this week are not looking so good so far compared to the previous week.
It seems that the US is the main country for users, with Italy 2nd. I wonder if this is because of the OpenMaint (from Italy), The OpenMaint seems to be the most popular part of the site.
Chrome seems to be the most popular browser, IE 2nd, which is interesting, this infers that a lot of views are from companies that have IE as main browser (inferring older corporate IT systems), with the beloved Firefox 3rd.
I know my session duration’s have been dropping. I may have to look at the yearly ones and see if its a seasonal thing.
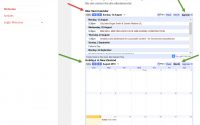
Scheduling updates/refresh of data
I have scheduled daily updates between 4-5am so that the charts are refreshed.
On GlideApps they do not like iFrames, so I wonder if I can update a chart and get an image from it to save to the same location (Apps Script) so that i can upload latest image which will reflect daily update.
End comment
I am pleased with the result. I think I’ll have to do a few more of these to drill down to find information that I may be able to understand.
Now that I have a controllable process I’ll look at the metrics I can get and do a few reports.
Totally FREE Property Management Information Site Part 2

How to make Screen Capture Video’s and post to YouTube for free