Study of Wellington & Harbour Dam for Sea Level Rise. City roads app & scripts
I really enjoy the curated maps that Keir Clark presents on his Maps Mania website. I get them through my RSS feed and there are some pretty interesting ones.
He had this article Sub Francisco about Andrei Kashcha’s City Roads rendering in brouser of a selected city roadways. After selecting your city of choice you can customise how it looks.
Not only that but he has a couple of scripts that add some interesting information to the map, using the Browser “Developers Console” to add detail into the maps.
It is a link to city-script. There are 2 scripts at present,
Find Paths– Allows you to draw thousands of shortest paths in any city between two random points, or between one fixed point and thousands random points.
Elevation- This script renders roads with different colors based on elevation level above the sea. The data comes from MapBox. It is part of the growing collection of scripts for the city roads website
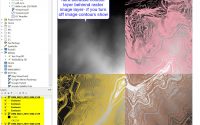
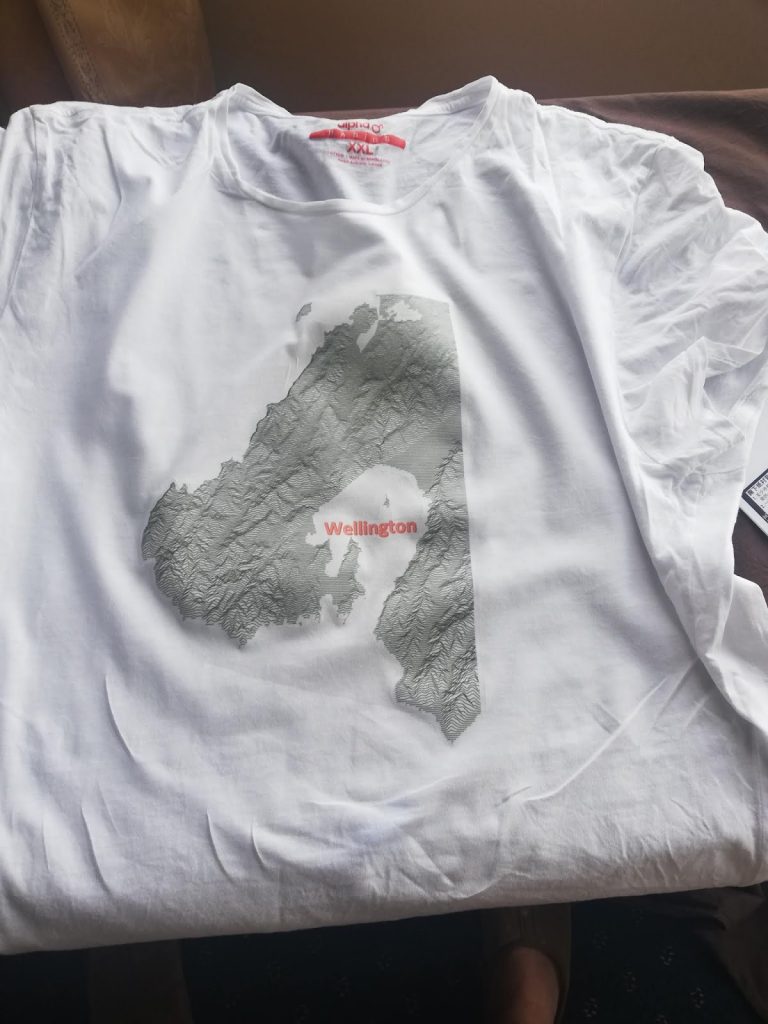
Map Heat Transfers to T Shirts
On one of Keir’s previos posts he had maps doing contours and I wanted to try doing images on a T Shirt with Maps. I wrote about it in this post.
Testing the city Scripts
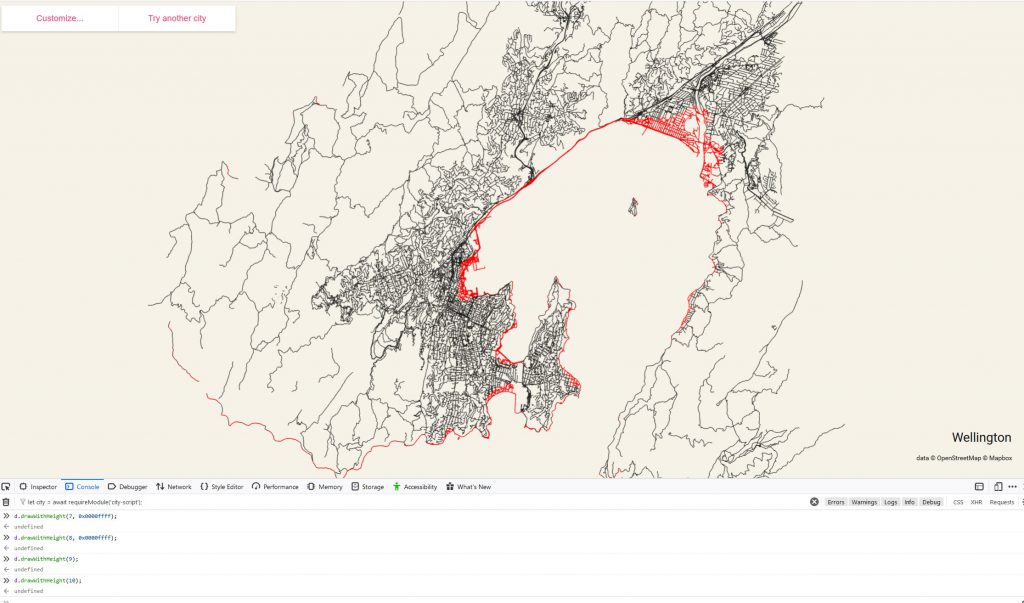
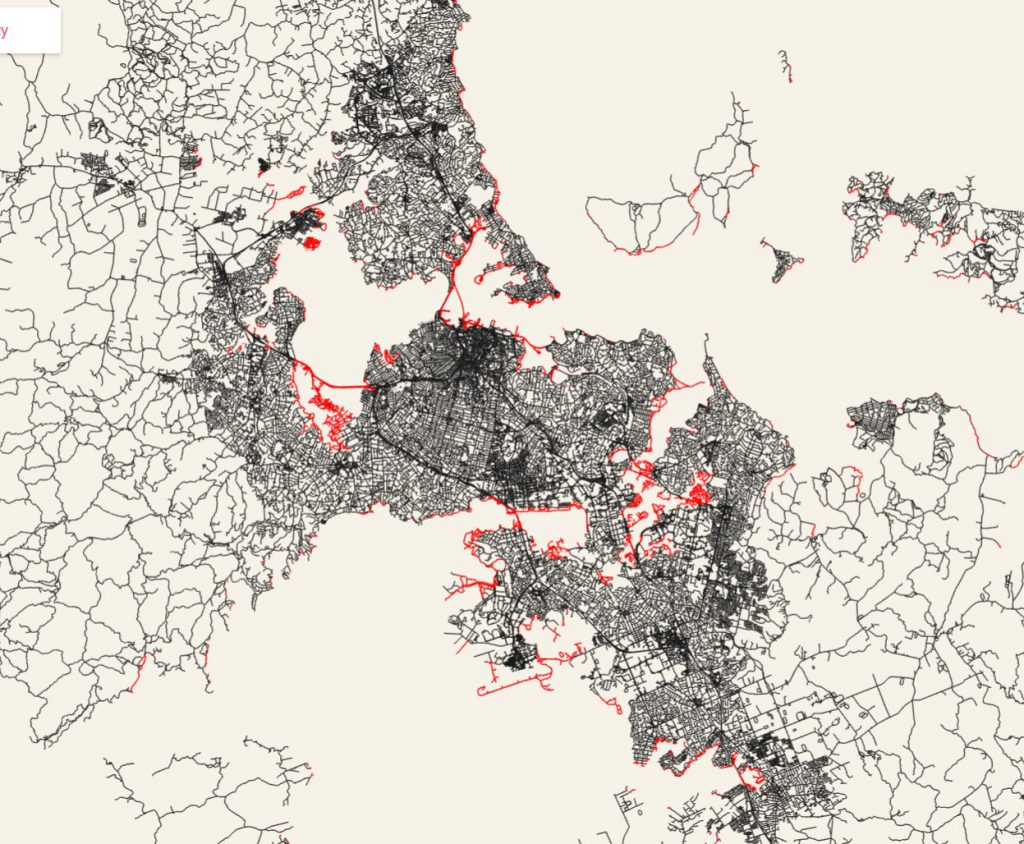
I plugged Wellington in for the city and then used the elevation script in the firefox developers console to to show different elevations for sea rise , the image above is for 10m rise in sea level.
You could then explore things like sea level rise and Dams. As per this article by Big Think
With more iterations you could show consequences of higher flood levels to show vulnerable areas and then show consequences of the sea rise and show how dams could protect the region
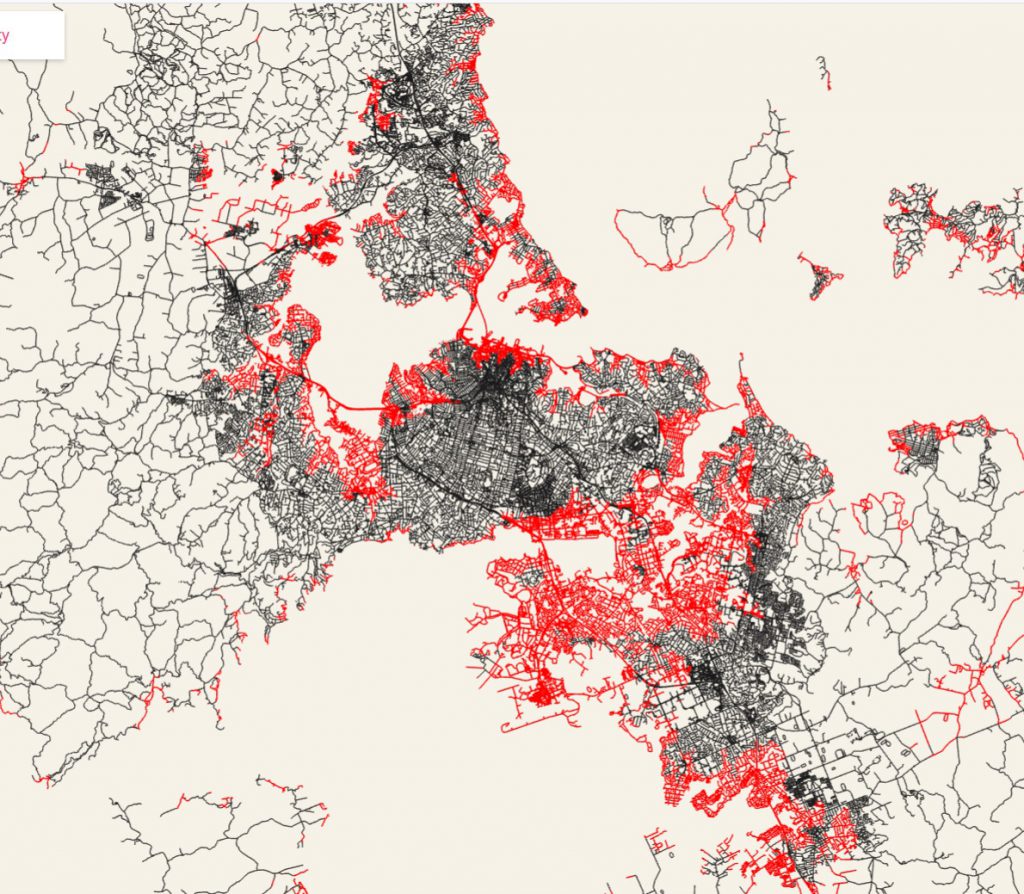
Wellington & Sea Level rise
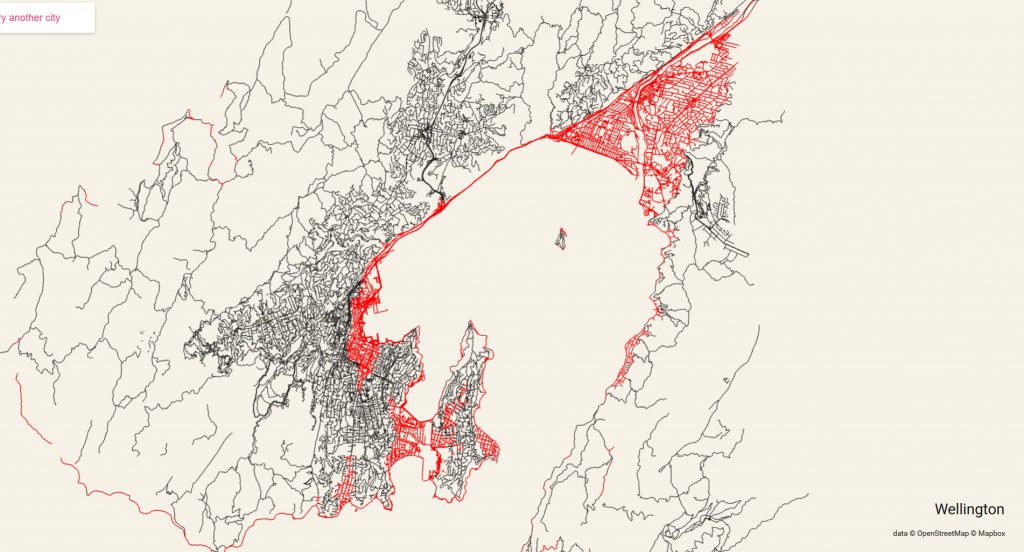
The image above shows a 20m rise in sea level, thus demonstrating possible areas of damage including most of Wellington CBD, the Kilbirnie/Rongotai & Airport area and an awful lot of the Hutt Valley.
Obviously this is very extreme, but in Tsunami and high tide situations it starts to demonstrate areas of vulnerability in the region that could devestate the economic engine of Wellington.
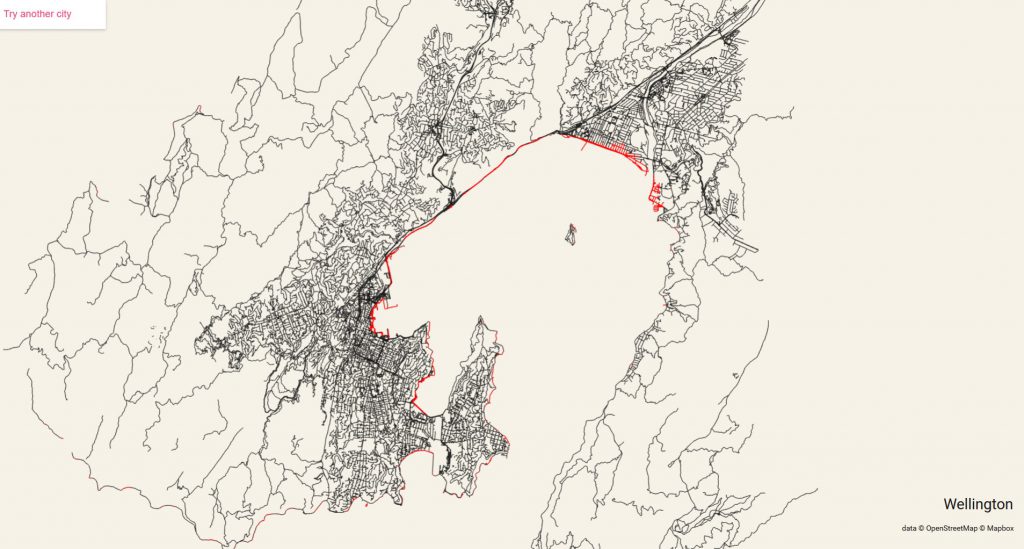
Stepping back, even a 3m rise will force the closure of the main motorway to Porirua and the Hutt Valley , apart from the back road via Kandallah to Johnsonville (or the even more tedious road via Macra/Johnsonville.
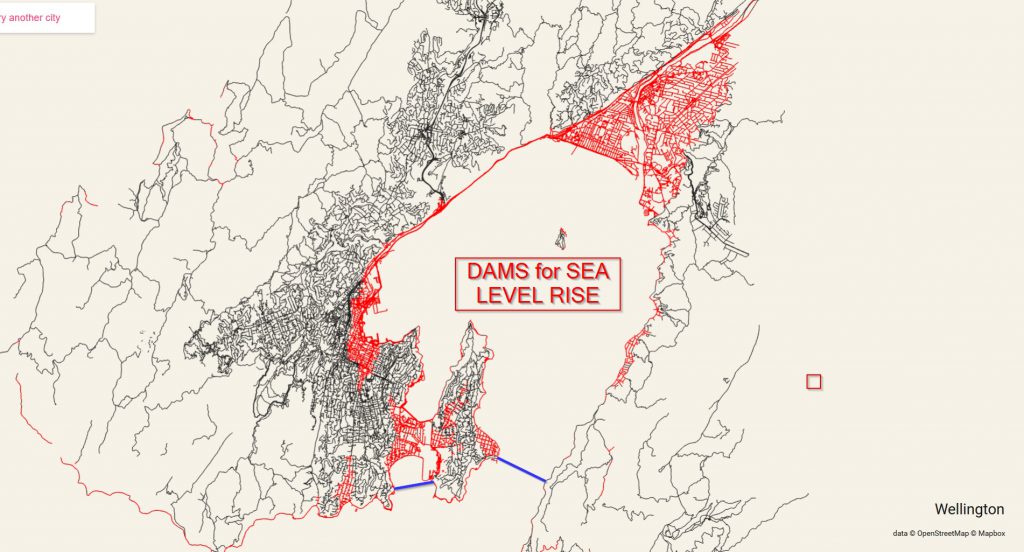
Wellington harbour Dam?
So what about a DAM along the lines of the European dam discussed in the Big Think article?
You’d need to block the Harbour entrance, a gate system for high tide and lock gates would be required for continuous use. From Fort Dorset across to the Eastbourne side of the harbour, a distance of about 1.89Km
The Kilbirnie area would be vulnerable to sea coming through the low lying ismuth, so that would have to be protected on the seaward side by either a sea wall or along the shoreline. A line from the Old Quarry by Dorrie Leslie Park across to Moa Poit (directly under Water treatment plant on hill) is a distance of 1.4km
Where to put resources?
As is starting to happen all around New Zealand, Government & Local Councils are having to make hard decisions as to where to pour their resources to respond to Global Warming and Sea Levels Rising (SLR). Some areas will be losers, like Island Bay, which will be vulnerable to SLR while other areas, such as the CBD will need to be protected more thouroughly as it holds Central Government & the main business district.
In the long term scenarios you have to look at the best “Bang for your buck”. So protecting the whole of the Wellington harbour with Dams could be more effective than trying to protect the whole of the coastline.
An economic strudy looking into the consequences of sea level rises and different scenarios should be put into the public arena, or maybe not, it may cause a lot of people to head to Auckland
What about Porirua?
3m rise, not so bad in Porirua Basin
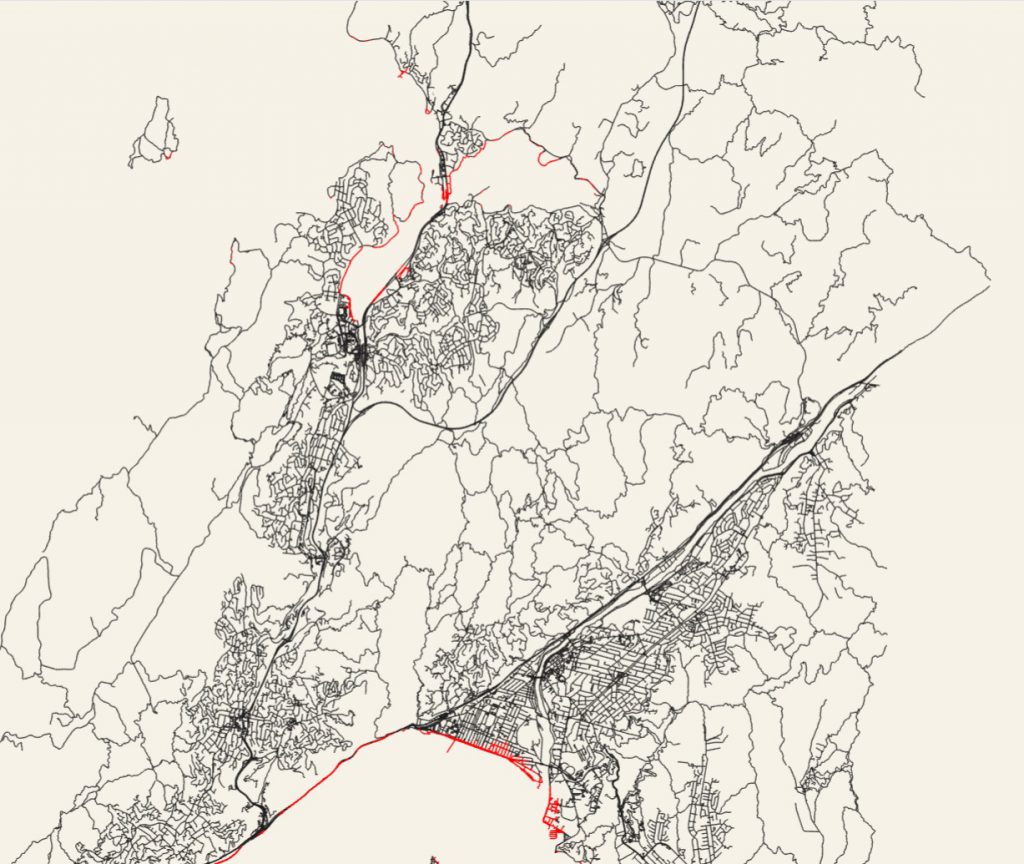
20m rise, looks interesting. Downtown Porirua is not in good shape, maybe another dam? It would need to be before the pahatanui inlet. mana will not fare too well and the railway will be a bit vulnerable.

Auckland?
So with a 3m seal level rise in Auckland, a little bit of inconvenience around the edges
But taking the 20m Sea Level Rise exercise it does not look very pretty at all, there is a lot of infrastructure that will be exposed and possibly using Dam’s will be a lot more complex.
End thought
Obviously the 20m rise is so over the top, but it does start to highlight low lying areas that will be vulnerable. What about a 3m rise and a Tsunami? That would have extreme economic consequences.
This was a fun exercise exploring the Andrei Kashcha’s City Roads tool. It does allow you to explore “what if” scenarios for Sea Level Rises and how its likely to affect your city. This in turn allows for some long term thinking on how best to use resources effectively to mitigate this potential challenge in the future.