Visual Asset Strategic Tools. Capture Building Information for Building Life Management. Open Source/Low Cost Technology Solutions for you to control your buildings
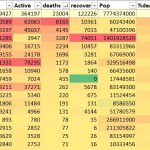
At the end of the last post I’d found that the original NZ regional dataset had changed. I was also finding it slow working in Google Sheets as the interwongle seems to be slow with so much demand. So I decided that I’d start working locally. My current process is to get the data, manipulate
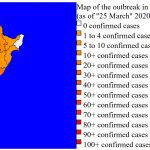
At the end of the fist part I’d got some data to play with from a couple of sources, cleaned it up, got some data to make paths to create a map and coloured map in by region based on covid cases. This was done using Excel, Notepad++ and displayed in browser. I was just
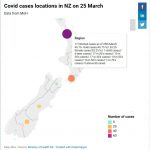
I’m thinking of trying to do an NZ map of regions where cases are. I’m using link to Wikipedia 2020 coronavirus pandemic in New Zealand page for data on region data. I have been looking for polylines for these regions and also centroids for region polylines. No luck so far with centroids but I got
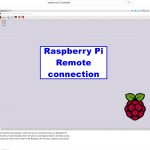
After my partial success with the Arduino chip button test I thought I’d dust off my Raspberry Pi 3 Model B that I’d bought years ago. I hadn’t played with it, I’m not sure why. I’d taken it out of its packaging but hadn’t even installed the micro SD card with Noob setup. So I
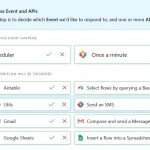
Somewhere I came across Standard Library but best searched for under StdLib. I signed up for it and found a couple of videos. It looked like magic and required serious coding, so I put it down at the time. I have been receiving regular “onboarding” emails (Seems pretty common and irritating when you sign up
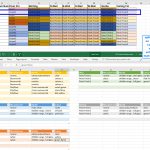
I found a post that had an article about an Excel type spreadsheet that you have in your web page with the benefits listed below, so I thought I’d have a play with it. jExcel is a lightweight vanilla javascript plugin to create amazing web-based interactive tables and spreadsheets compatible with Excel or any other
I’ve been messing around Revit URL parameters. The thinking goes thusly: If I’m on a mobile device, I can scan a QR code for URL to take me to……, but what if I’m on my desktop and want to follow a link? I dont want to go to the hassle of scanning a QR code,
I first wrote an article about Bar codes & QR codes QR Codes and testing quite a while back. I also played with putting Barcodes onto Room Data sheets so that the Room ID could be scanned. I’ve just purchased a Label Maker. I was looking in a Stationary shop and came across a whole
The last post I tried to use AirTable to create a Colour Schedule from a Revit export. Thinking I could use the Database to cross reference items in the room such as doors/windows etc to be able to pull those in to make the colour scheme planning more comprehensive. It didn’t work. Along the way
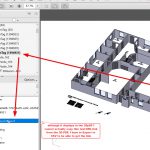
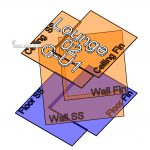
Background I have written a post on showing internal building fabric condition over time in this article Revit Internal Condition over Time.I was not, at the time, happy with the presentation of the information as it was a series of screenshots that I then put in as slides to step through the process. Two things