Revit internal condition over time GIF
Background
I have written a post on showing internal building fabric condition over time in this article Revit Internal Condition over Time.
I was not, at the time, happy with the presentation of the information as it was a series of screenshots that I then put in as slides to step through the process.
Two things bothered me, one was the inconsistency of the screen capture on the different images, the second was the static step through the images showing the changes.
- Speed up the tedious stuff and enjoy designing and documentation more
- Works in all versions of Revit
- Information to PROVE your increased speed
In one of the Revit RSS feeds I came across Image-O-Matic is back! And Free! https://boostyourbim.wordpress.com/2019/01/11/image-o-matic-is-back-and-free/. I thought about the programme and watched the demo, unfortunately I do not have Revit 2018 so could not test it. Basically it seems to make an animation of stills. I thought, that’s exactly what I needed to do my internal building condition.
Exploring productivity tools I came across GreenShot free capture programme, that has a feature of “Capture Last region”, so you can screenshot the exact location of the previous screenshot.
Exploring QGIS I came across this video Time Management Animation – QGIS that uses an online gif creator, gifmaker.me from slides that are created from the maps and combines them into an animated gif. The tool will also create a video as well.
Then I tried to open a test animated gif and it got miffy, in a web page its easy to embed, just like an image. So combining all these elements together I thought I could make the animation that I wanted.
So, I went back to my old Revit model, also the old dataset that I had and re-setup a process to display the information.
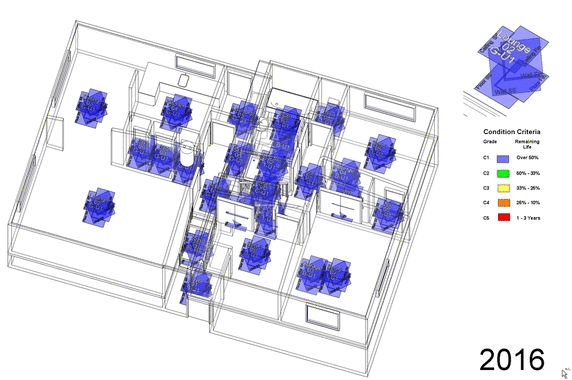
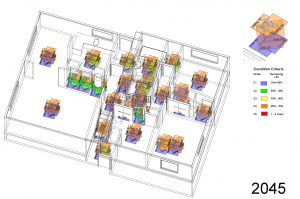
The result
The gif file. This shows the internal floor finishes, wall substrate and wall finishes, ceiling substrate and ceiling finishes changing over time from 2016 to 2045 (29 years)
Here is the video doing the same as the GIF above but you are able to pause it to see specific changes.
Using Icon to represent finishes
An earlier attempt to show the condition of both the lining and the finish met some difficulties, as you’d have to overlay 2 colours on the same objects.
The first method I used was to create 2 views in Revit to allow one for the linings, and one for the finish.
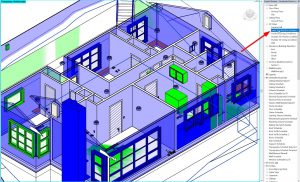
This is the linings view
This is the Finishes view
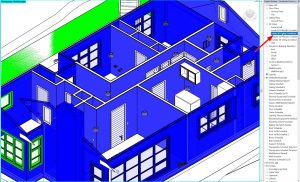
To be able to represent the information I had to make a lining wall inside the room using the Room Finisher add-in and then join the walls so the doors/windows would show through. I could then colour them using shared parameters and filters to control the colours.
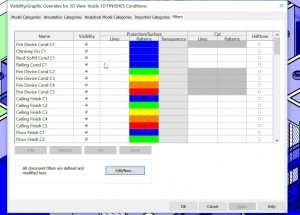
I came up with an alternative method using different categories to represent one of the linings/finishes, eg Data Device or Telecom Device, unused categories which I could use to filter and colour and also embed shared parameters to.
So I came up with:
- Floor Lining/structure
- Floor Finish
- Wall Lining
- Wall Finish
- Ceiling Lining
- Ceiling Finish
In the physical survey on the properties they did not collect data on the floor structure/lining. So in reality we only had 5 categories.
I represented these as 2 parts, the finish on the top and to the right, and the lining underneath and to the left.
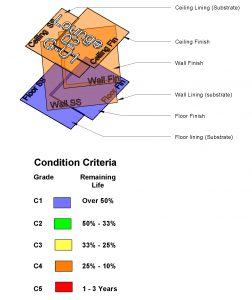
This way, you could display the condition both the lining and the finish in one model for each room.
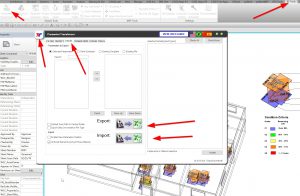
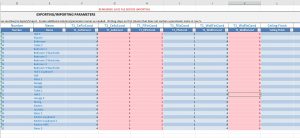
I then took the survey data and extrapolated it out for year on year as per the heatmap post, Excel filterable Heatmaps for Asset Condition over time online. From the extrapolated data I could map it to Revit Room Schedule which I exported and imported into Revit with the updated Yearly condition using the Rushforth plugin excel import/export tool. After updating the Revit model with each years condition I took a screenshot with Greenshot in the “capture last region” so that all the images aligned.
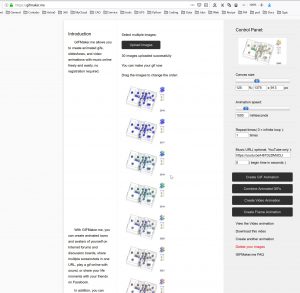
then I used the Gifmaker to actually create the gif. It allows you to add music so I fund some no copyright techno and embedded it.
I made some video’s and gif’s, I played around with some of the duration’s and sizes. I had trouble embedding the video (MP4) in the WordPress website, so had to upload it to YouTube and then use the embed code from the video there to put it on the page.
End comment
It was a longish process, I got quite a way through and was not happy with the result, so did it again. In Excel I used the macro recorder to help filter the tables to speed up selection. If I was to do this on a more commercial basis I would look to either use a database or Knime to process the files more quickly. Also, maybe having a number of shared parameters in each category to speed up the process for import/export to Revit schedules.
I did have a little tinker with RTV Reporter Pro about doing the setup there but decided that I’d just use spreadsheets to do the processing as this was a one off prototype.
I am pleased with the result. I thought the online GifMaker.me is a cool site, I’ll try and use it again for another post on something. It was fun to play with and the result was very satisfactory.
It was nice to re-visit the project and do it again in the way that I envisaged it.

Web Data 3- Part 2. Google Sheets API to Web Page automation
Forwarding Emails from my email Server