Python for Data Analytics and other good stuff
just reviewed my website and see that I have not posted anything since November. A change of habits and a focus on some different projects.
The change of habit is in using Obsidian for most of my note taking of late. I find it a very handy tool to chart progress on projects I’m working on. Before I’d use this website to chart projects as I progressed through with them, splitting them into parts as I progressed. So that change of habit means that I haven’t been posting as much on this site.
Python Data Analytics free courses
The 2nd thing is I’ve been learning Python for Data Analytics. This sort of started in one location, looking to use it for a building project, after seeing there was a free course by Singapore University Data Science for Construction, Architecture and Engineering and then my daughter wanted me to do some things with API’s for collecting data for her business and so I started using Python for that too. Another course that I thought was very good was one that emailed you a different topic each day by Datagy Learn Python. In just 30 days. This was a good straightforward course that had lots of good examples as well as videos.
My YouTube playlist of videos on cleaning data and API calls and processing
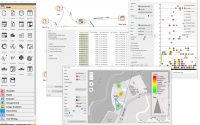
As I was working on the project for my daughter, gathering information regarding plants in a greenhouse and getting data via sensors from 2 separate API’s, I was sort of hopping all over the place, trying to do a large number of disparate things and I was worried that I’d forget the odd things I’d found that I needed to make a note of. I ended up creating a channel for python things I was doing, so far there are 7 videos on the topic, they can be found HERE.
- 2 are on dirty data, the cleaning of information so that it can be used
- 5 are on API and automating the API call for data and then uploading that data and inserting it into a Database table and getting an email verification when it was completed.
The team I’m working with are comfortable with Excel but there is so much information from the API’s that storing the information in excel files for use is not really sensible, so I’ve been uploading it to a MySQL database on a remote VPS (Virtual Private Server). This allows for anyone to access the data remotely.
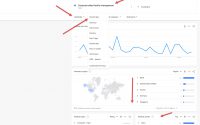
Google Data Studio Dashboards
This then brought up another set of challenges, that the people of the team were not that au fait with database and how to obtain data from them, so I needed a form of interface that would allow them access to that data. After exploring Dashboards with python Flask and other tools (PowerBI- community) I ended up using Google Data Studio as it has a lovely feature where you can download a dataset from criteria you set on the dashboard (eg Sart/End dates) and it will export a CSV file with the data from a Table. This allows for me to setup interfaces of data that they may want and then they can access the data at their own convenience.
Python Flask works well with data but you need a paid connector to connect to DB’s, Power BI I tried but then moved away from as at the time I was experimenting with Plant layout heatmaps and Power BI couldn’t seem to do this , and Google Data Studio links to remote DB’s without any problems, although it can be a bit unstable and delicate in my opinion.
Google Colab for team to run python scripts
Another tool I started to use was Google Colab, which is a Jupyter type Python Notebook inside Google Drive, it allows you to create a python script and upload all the necessary libraries without team members having to know anything about python, install it on their PC’s or pip install libraries. This has some uses for the team as they are getting data from some controllers at minute intervals and want the data at hourly intervals, so python pandas can resample the data to the time frame they require, so you can have about 4200 minute samples reduced to about 750 samples at hourly intervals. This makes it easier to use in an Excel Spreadsheet.
The team initially tried to do the resampling in Excel but found it took a long time, whereas its very quick in Pandas, so there are python scripts they can use to pre-process data to get it to a state where they can use it conveniently inside Excel.
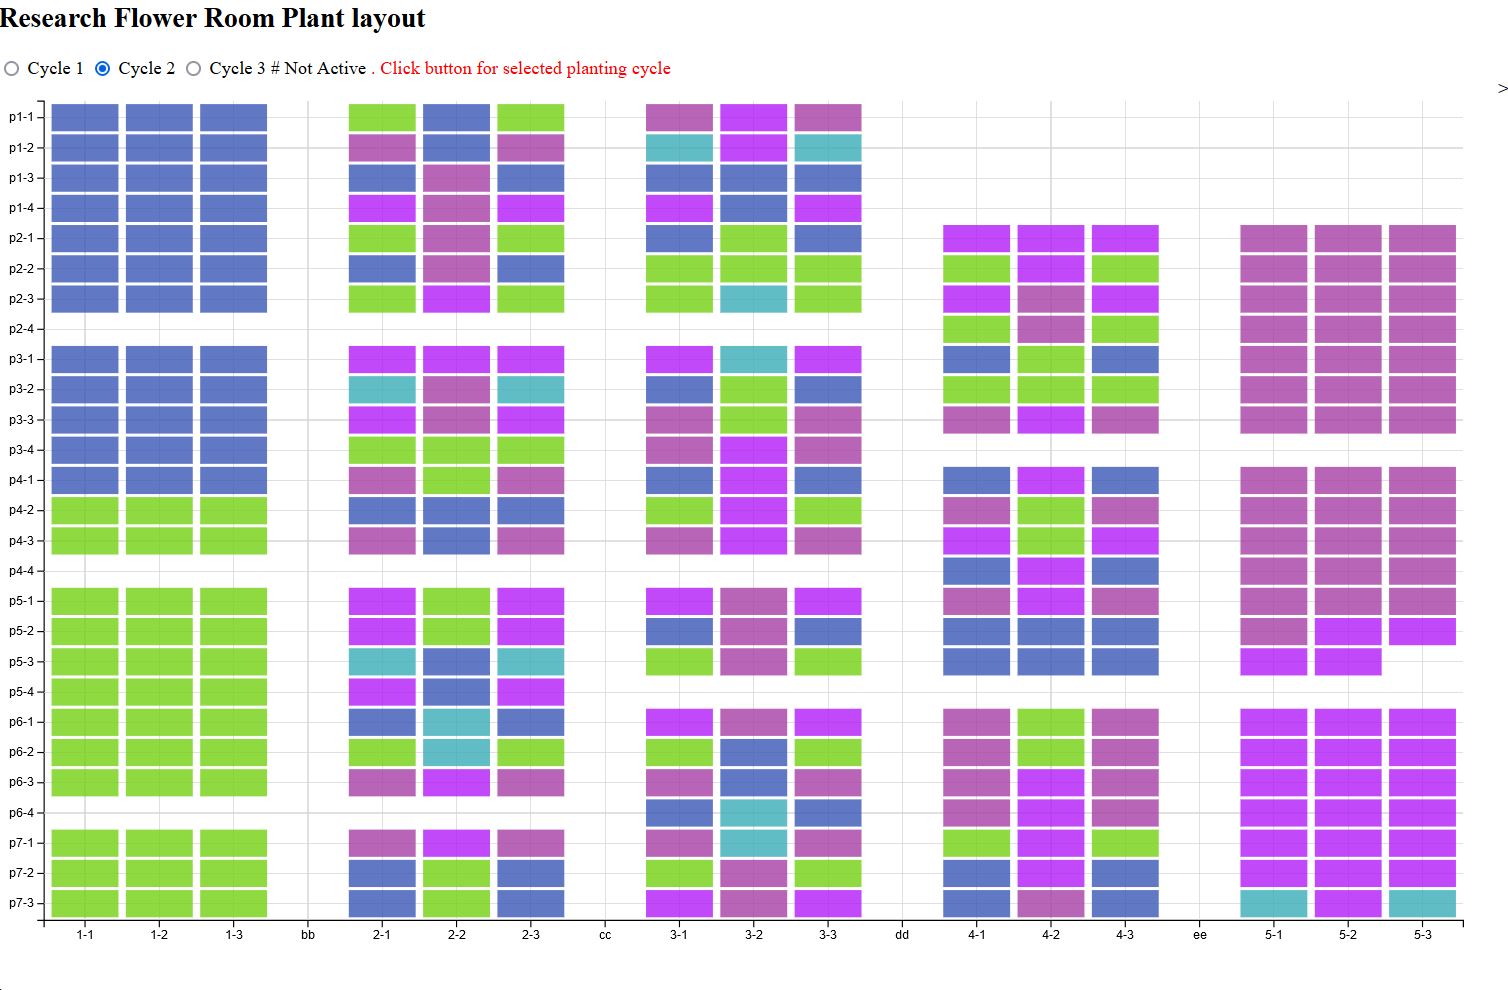
Heatmaps and plant layouts & data
Another area I’ve been exploring is identifying where a plant is located within the passage of growth through the growing cycle, where you can take a location and hover over it to see information about the plant and the location.
This is a work in progress and currently reads from a CSV file, which is adequate for historic grown plants but may need to be adapted for current newer plants. As reading from a remote SQL database may be slow. There is a method of doing a materialised view in MySQL and then saving a daily CSV file to make sure that the information is up to date. I am still working through issues on this part of the project.
End comment
Since November I’ve been quite busy on a lot of different learnings with Python Data Analytics at the core and also working with SQL information, both populating, adjusting and extracting and also the objectives of visualising the data in some form or another, either by HTML/CSS/JS web pages and heatmaps or with Google Data Studio and other methods such as Python matplotlib graphs.
This project is still ongoing and I should be splitting this information into separate topics to describe them more effectively. To be looked at in the future I think