Visual Asset Strategic Tools. Capture Building Information for Building Life Management. Open Source/Low Cost Technology Solutions for you to control your buildings
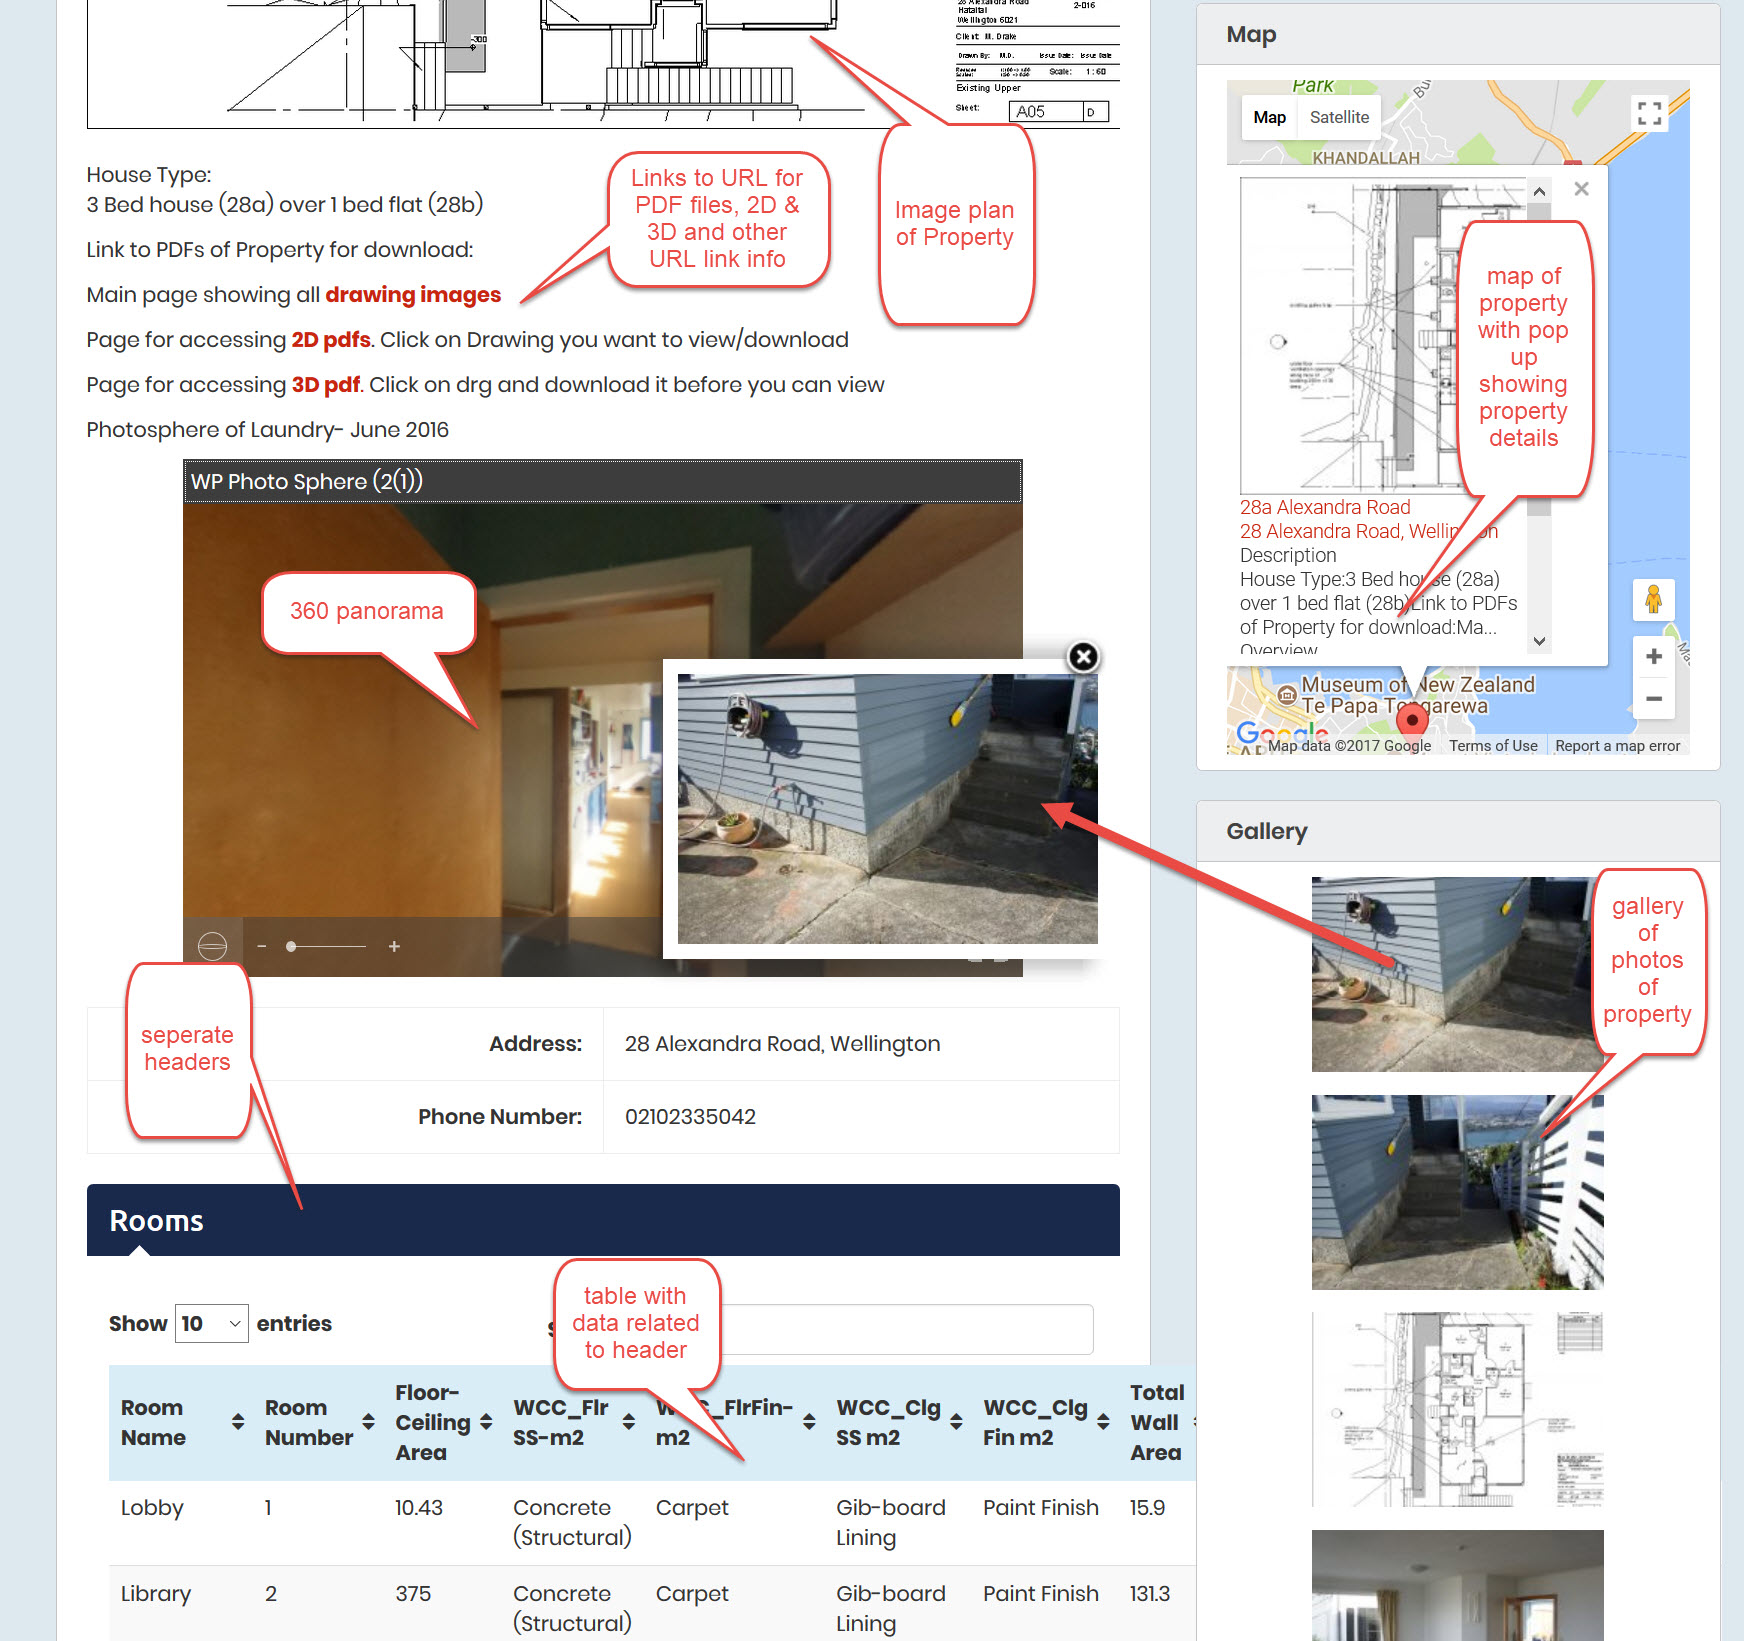
The demonstration site, which uses examples of different free plugins to demonstrate different features, can be found at apriori.ml. Looking at the WordPress themes (free ones of course) I saw there were quite a lot of real Estate Themes and Plugins and I wondered if you could adapt one of these to be a property
Hi All, Forum tab next to Home on menu bar. Or HERE I have noted that there seems to be quite a bit of interest from you out there on my openMAINT setup and configuration blogs. Obviously you are interested in the product and interested in getting instances of your own up and running. I
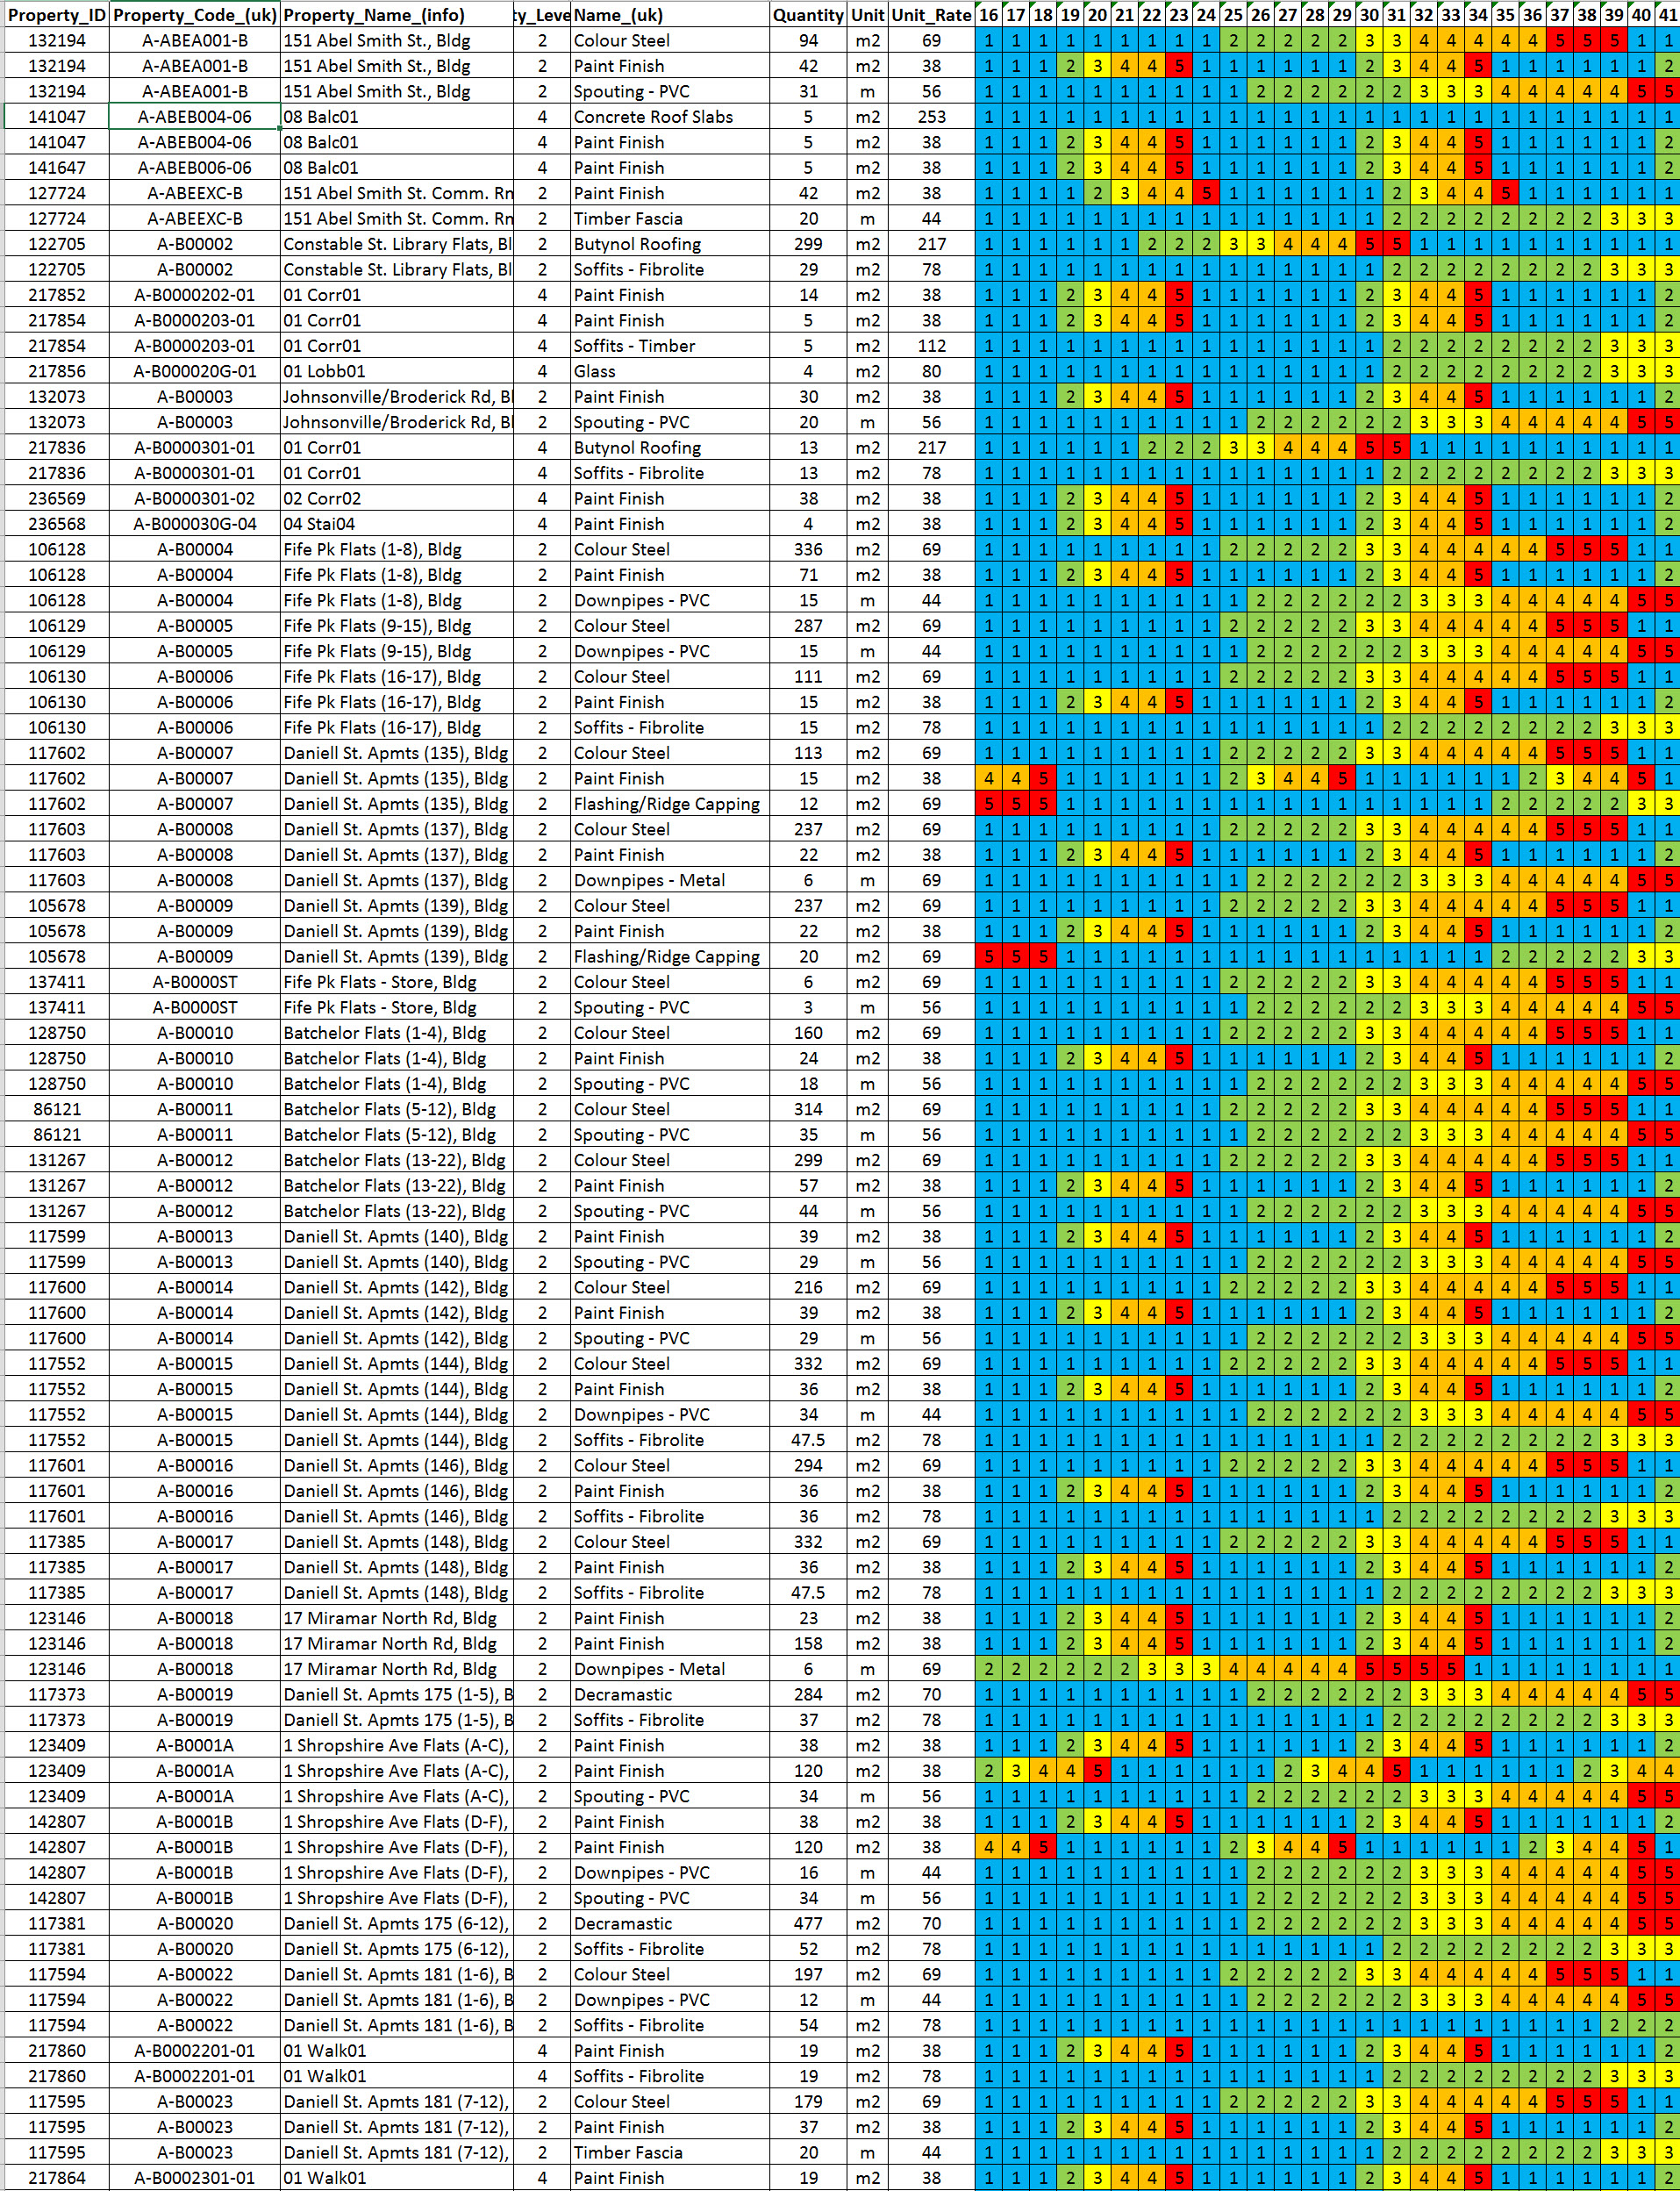
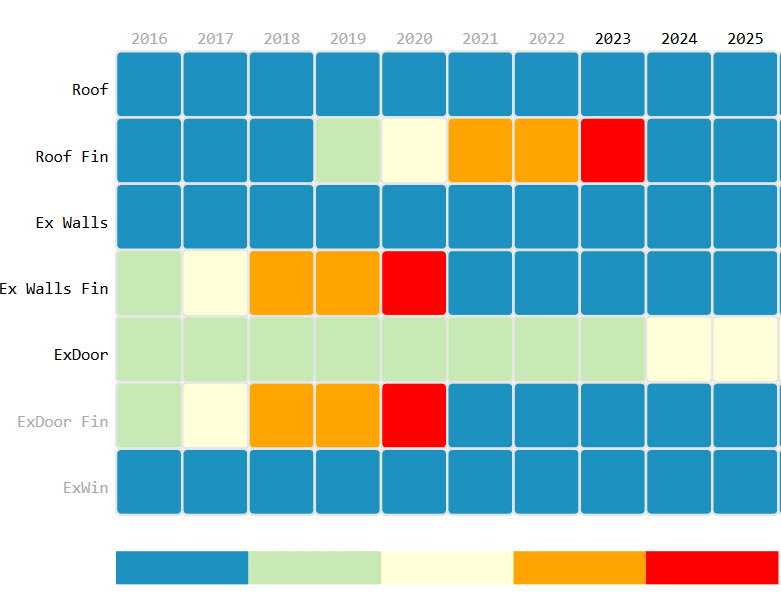
A method for showing condition heatmaps is using Excel to display the condition of the elements over time. Another post Heatmaps for visualising exterior and interior space conditions uses D3.js heatmaps. The good part of this is that you can use filters to explore the information and drill down into the data. Video (4min) I
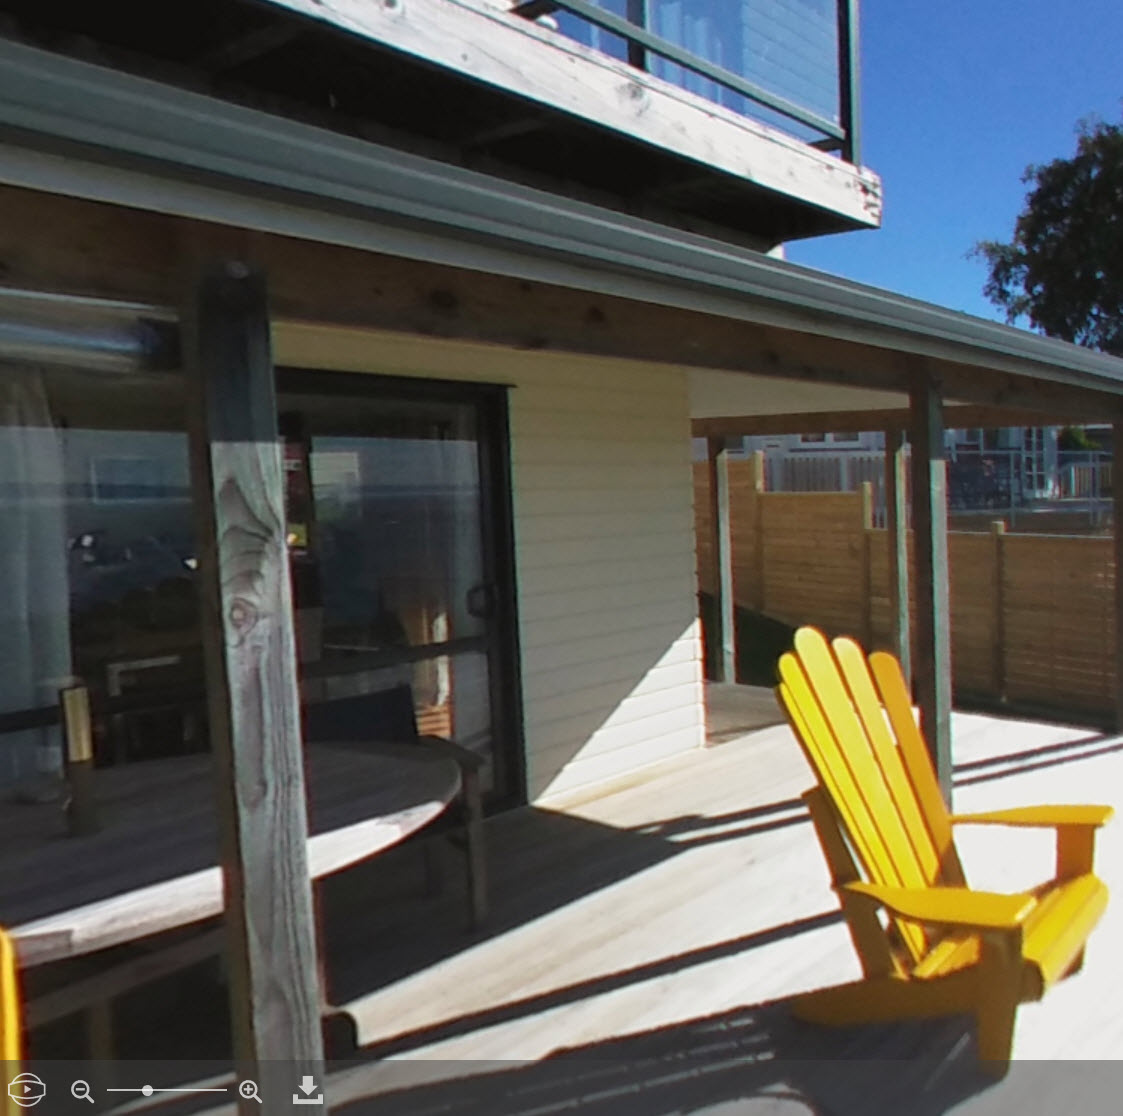
Video (5min) Your browser does not support iframes. Your browser does not support iframes. A quick survey method, where a general overview is required quickly, would be to use 360/180 degree panoramic photos. These are good to quickly identify conditions in spaces and also relationships with other rooms (through doorways) and to show items
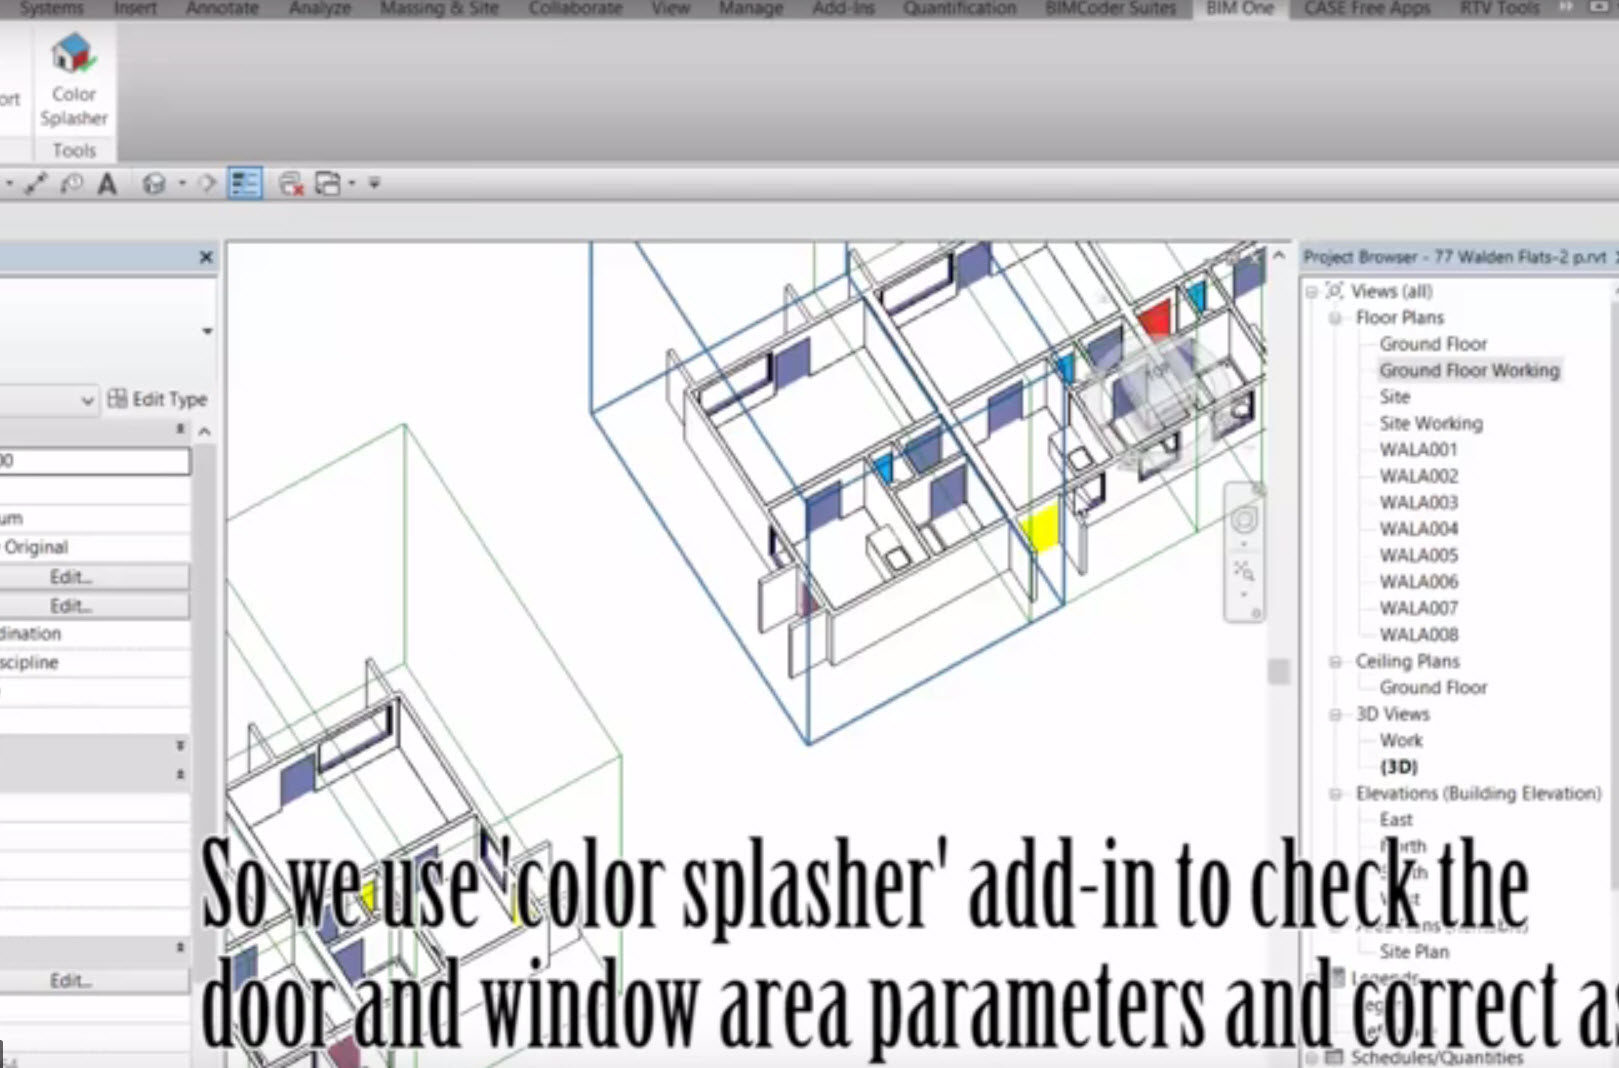
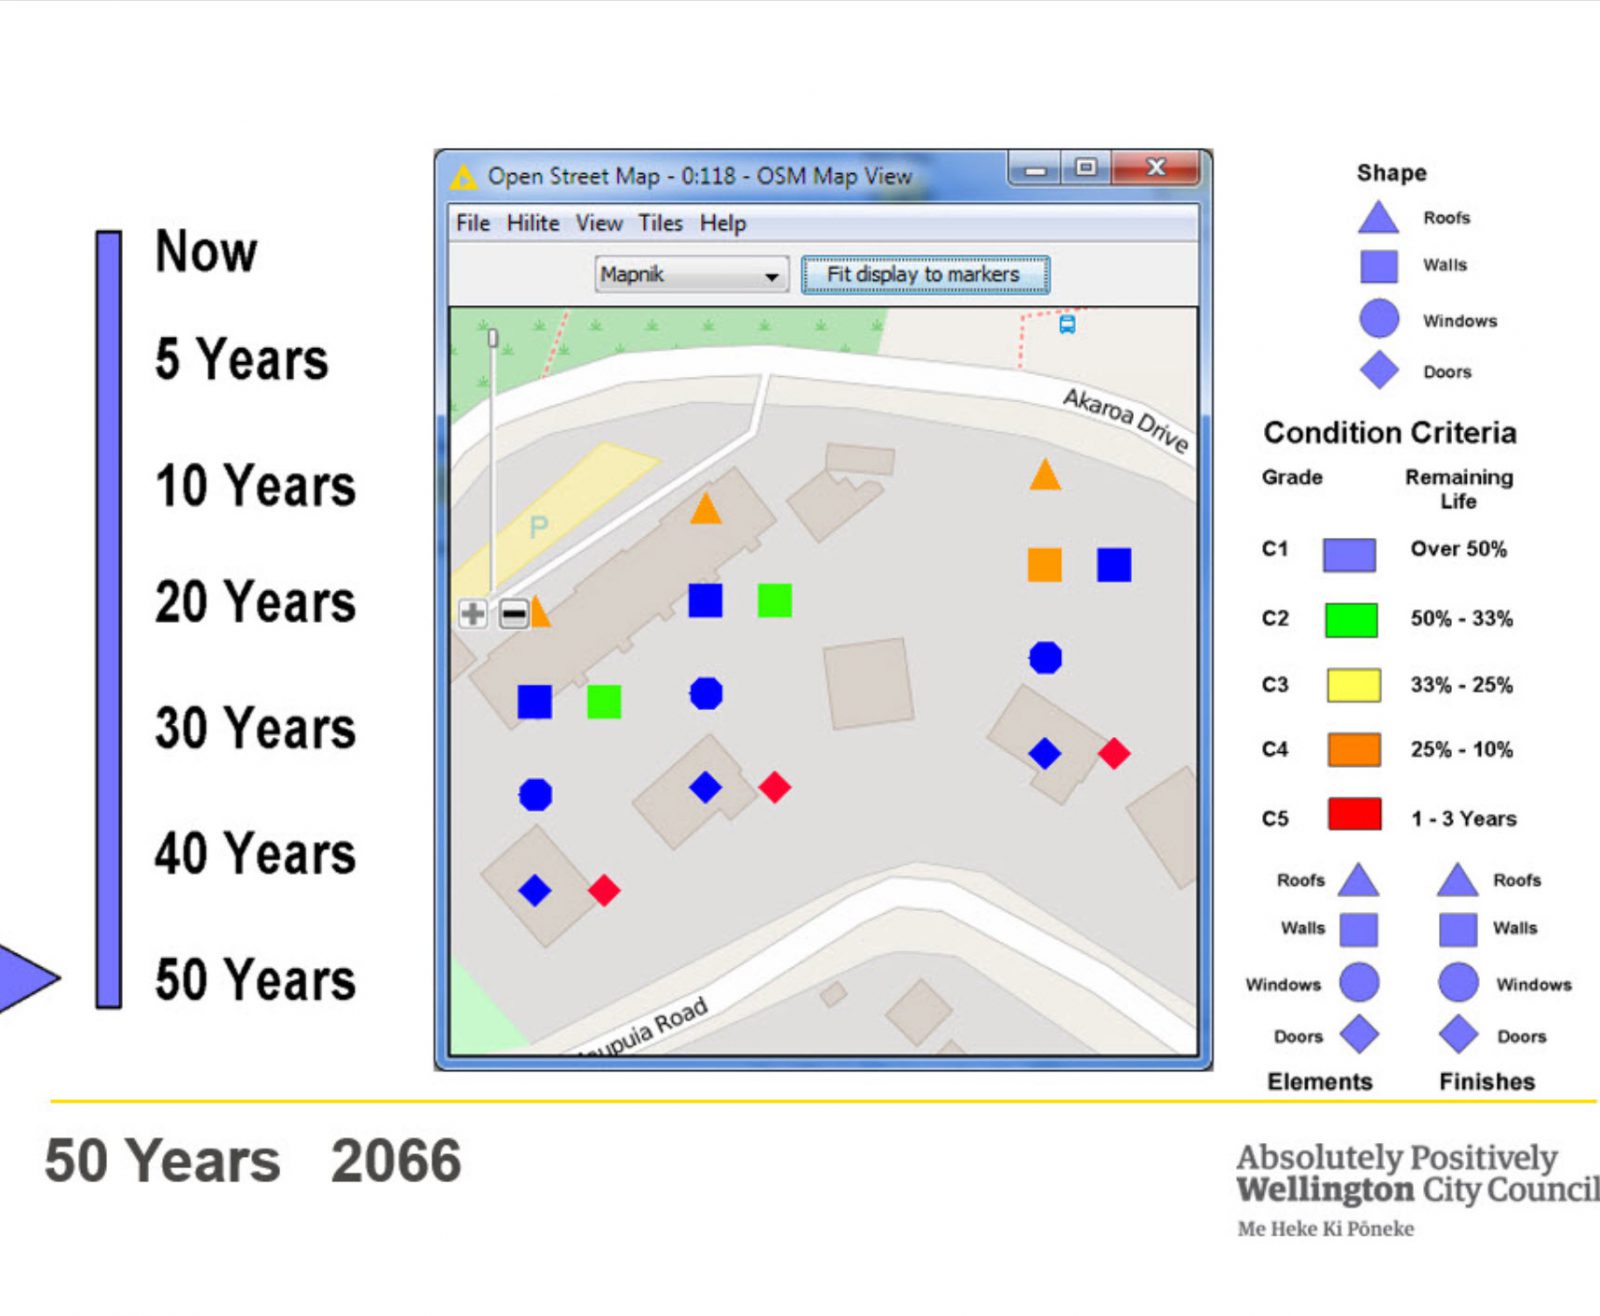
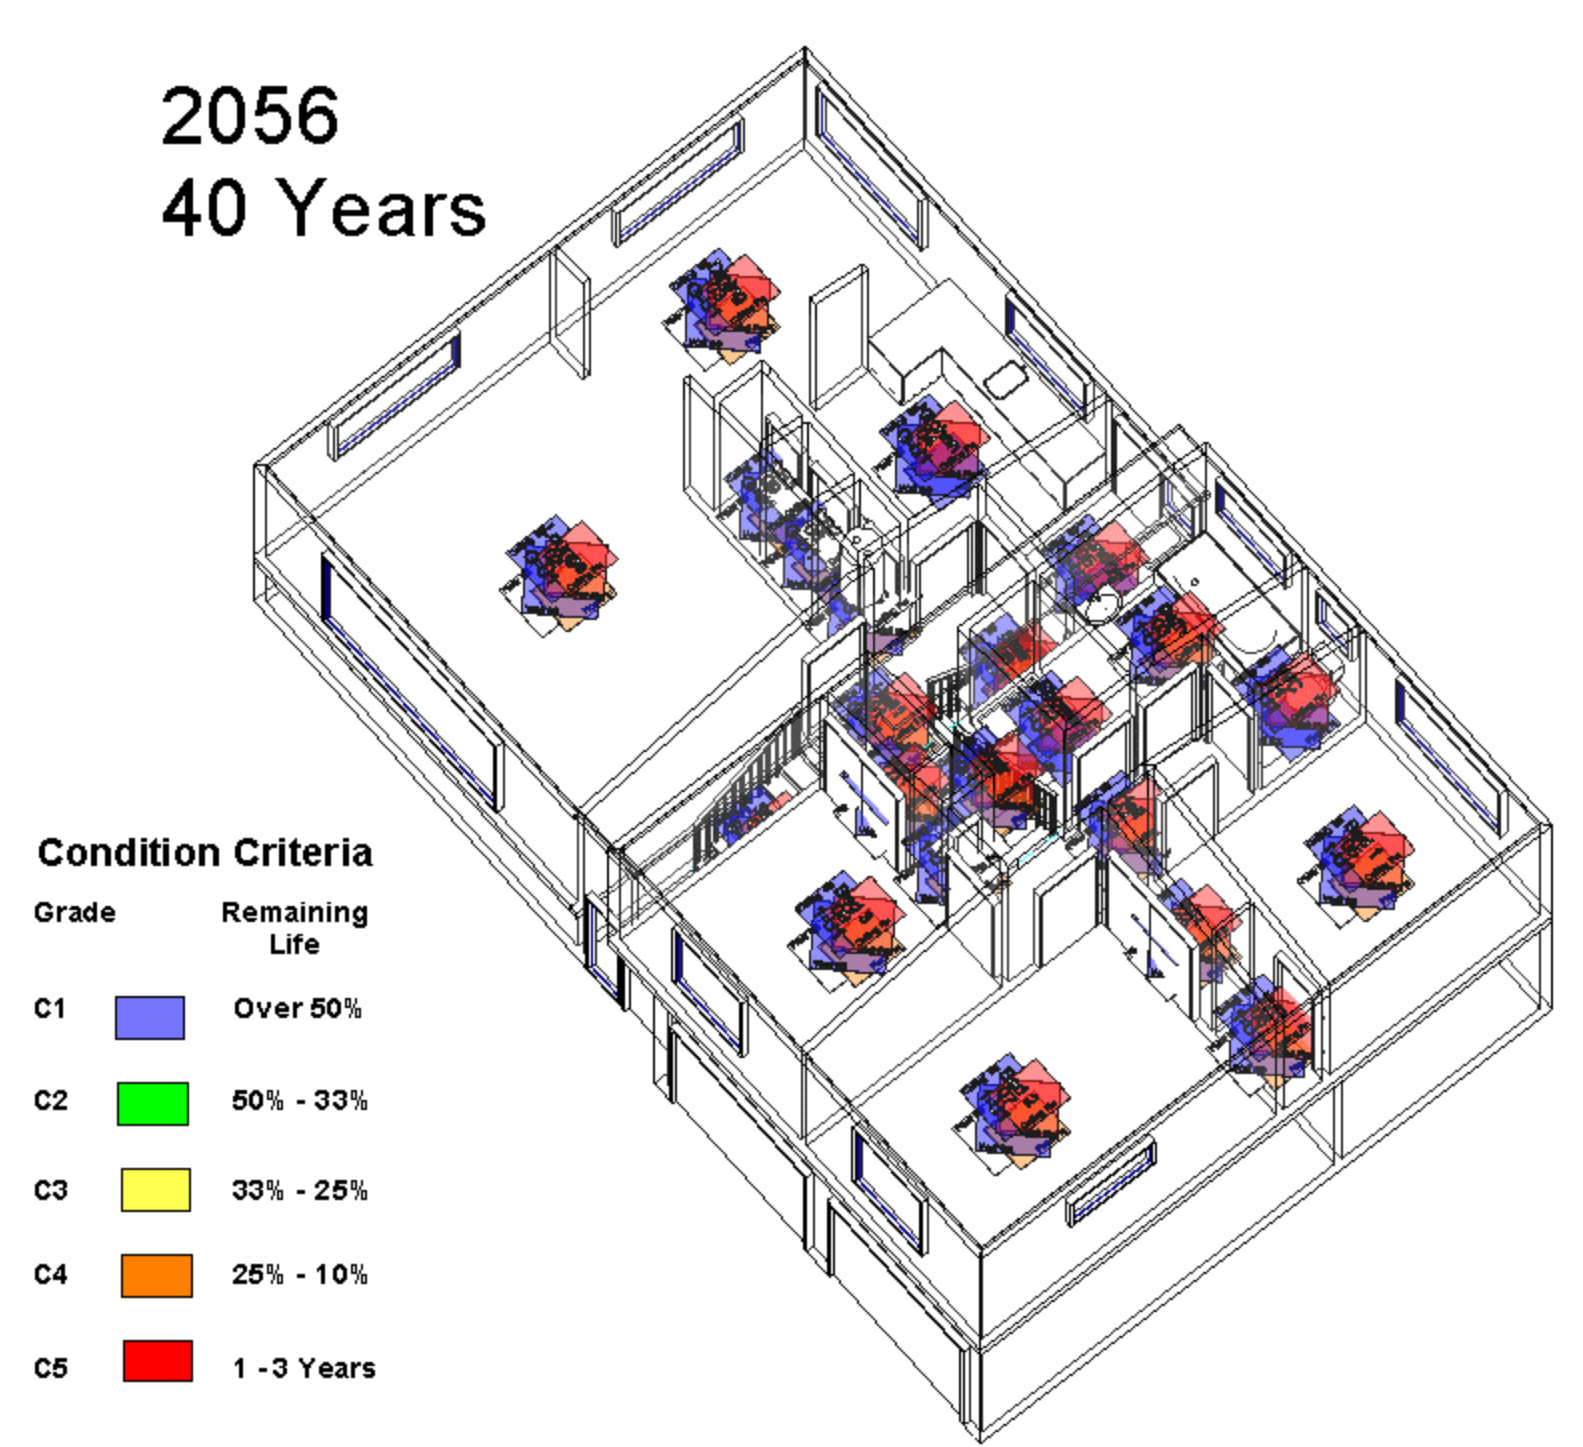
We can use the Map overlay icons to show condition of external elements over time (link) and use the location intelligence of satellite and street view to explore the micro-climate and materials on the building. But what about internally? One exercise was to use Revit to show condition at each different year and export the
Capturing information on existing assets is a challenge Wellington City Council (WCC) has over 2200 social housing units and so getting good information on them in a consistent manner was a challenge. They undertook a condition survey with surveyors on the properties. It took the surveyors on average 4 hours to survey each unit. There
Interactive exploration of Data Tableau Public After the first static processes of expressing Condition over time on a map Part 1 I explored using Tableau Public for creating an interface for users to explore the data. The House Conditions in Tableau demonstration allows for users to explore the data in a number of ways and
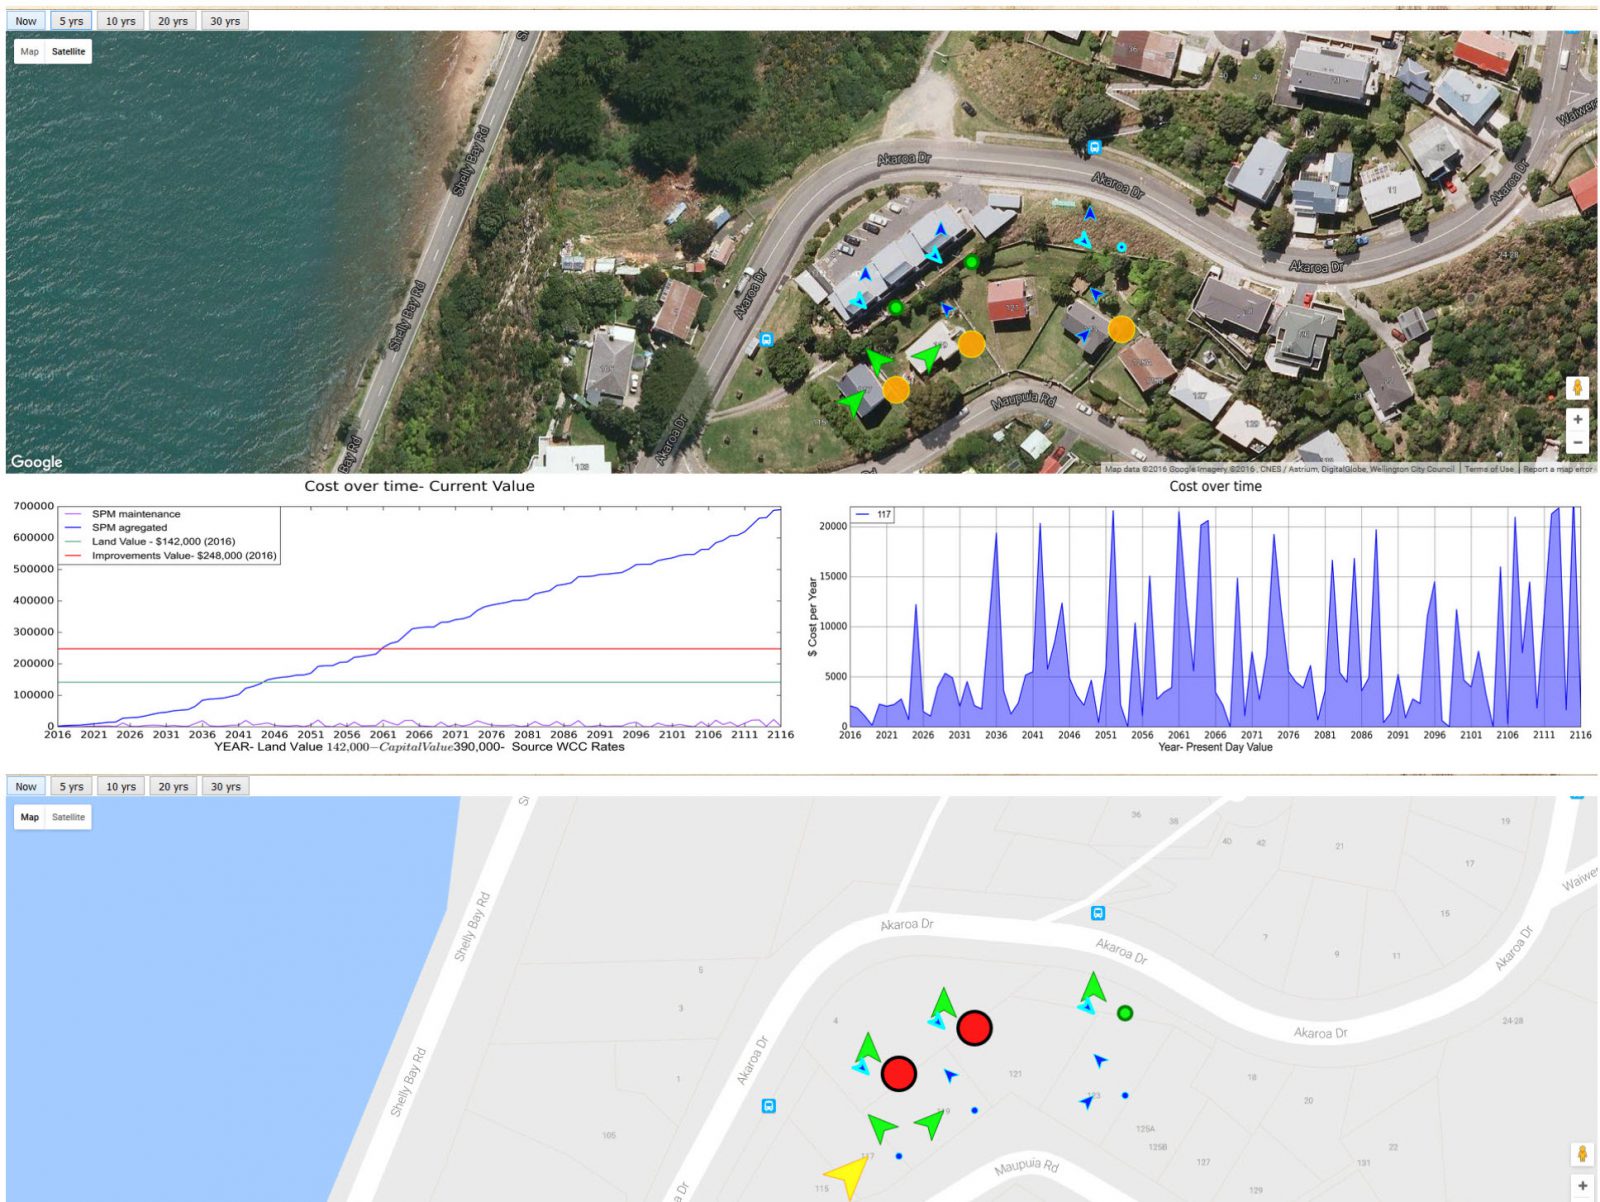
Visualization of geographic building elements Using the same dataset as the Revit internal Condition over Time , I wanted to explore how it could be used geographically to describe the diverse buildings and their locations around the city. QGIS One of the first things was to plot the buildings on a map. For that I
Visualizing condition over time for room finishes When shopping for fresh food, it has a use by date. Depending on when you purchase it, there is a count down to when it has reached its fitness for purpose. So, with a building, things depreciate over time, with different components or finishes lasting for different duration’s