Revit Internal Condition over Time
Visualizing condition over time for room finishes

When shopping for fresh food, it has a use by date. Depending on when you purchase it, there is a count down to when it has reached its fitness for purpose.
So, with a building, things depreciate over time, with different components or finishes lasting for different duration’s depending on expectations and physical wear.
- Speed up the tedious stuff and enjoy designing and documentation more
- Works in all versions of Revit
- Information to PROVE your increased speed
Data required for visualization
From an Asset Management Information System (AMIS) perspective , you need
1. Quantity of an Asset,
2. Expected Life of that Asset and
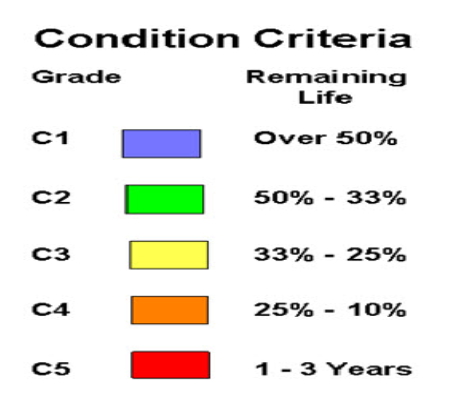
3. Current Condition.
With these 3 criteria you can predict when the item needs replacing. This is a simplification, as there will be an upper & lower expected life of the asset, and different products will have different durability standards etc, etc. But given these 3 criteria you can do simple prediction models of when things need replacing and so can budget for them. This is particularly important if you are planning on maintenance costs 10 to 20 years in the future, you can plan on saving for the depreciation of these elements at the start and spread these costs over a longer period.
Two things we have been exploring, one is visualization, the other, condition over time.
With AMIS models, it is data, so it gives answers on all items that degrade to such an extent over time. Where they are does not factor in to the process. Whereas if a Facilities Manager wanted to see where these items were failing and not lasting their predicted life , or where it was suitable to cluster work together as a package because of location, visualization is important.
The first exercise we did was to look at building fabric within a building, floors, walls, ceilings etc and their finishes.
We were following on from a visual survey data capture exercise which captured quantities and assets and condition. For the social housing exercise for a standard unit it was taking about 2 hours to capture all of the information. For the 2200 units (actually only about 1800 as some were to be shortly decommissioned) this was a big exercise.
As the social housing was tenanted, getting permission to access the units took quite a bit of organizing. It was considered important as access to repair items still required coordination with the tenant. So having good data on the facilities was considered useful for future work as quantities and types could be selected prior to going into units, reducing the number of repeat visits for a singe repair.
Revit, double views for Substrate & Finish
The first exercise I did I put a parameter in Revit to show the condition of a particular element at the last visual survey. The idea being that on the next survey we could colourise the model to show what the condition of that item was at the last survey, so the surveyor only had to make a judgement on quality/condition of the item (the quantity was already captured on the first survey) and it was felt that this would speed the process up from the original 2 hours to 20 minutes per unit.
When I first did the exercise, I manually put in conditions of all of the elements, and then tried to display them.
For component items, they were mainly pre-finished (Bath, Kitchen Bench etc) whereas walls , floors and ceilings had the substrate condition and the finish , for walls and ceilings, usually paint. So I had to display these views twice, once for the substrate condition and once for the finish condition.
Revit, single view with symbolic element for room substrates and finishes
The latest exercise was to be able to display the substrate and the finish in a single view and then use the same view as a timeline to show the changes over time.
The building starts in Condition 1 (v.good) and as the years pass the finishes change towards red first, as these have a short life, then they are upgraded and start in the blue again and repeat the cycle, while the more durable substrates wear more slowly, but before the 50 years they too are replaced.


Revit icon for substrates and finishes
The icon was developed to be able to show these different elements:, with substrates to the left and finishes to the right.

Using the icon the condition of other elements can be described over time without being overwhelmed by the room finishes colours.
These can be used in the 3D PDF’s as well .
- Speed up the tedious stuff and enjoy designing and documentation more
- Works in all versions of Revit
- Information to PROVE your increased speed
Two possible uses:
- For future survey of the same building, this shows condition either 1. At time of previous survey
- Can model anticipated condition at a specific time of a survey
For more information on the process please contact me. Following on from this is the mapping exercise for external elements Mapping condition over time Part 1
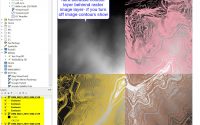
Lidar to Dwg- Getting contours from Lidar map

OpenMAINT 2. Export/Insert Data & Multiple Update procedures & links to 3DPDFs, Plans and Maps