Visual Asset Strategic Tools. Capture Building Information for Building Life Management. Open Source/Low Cost Technology Solutions for you to control your buildings
Capturing information on existing assets is a challenge Wellington City Council (WCC) has over 2200 social housing units and so getting good information on them in a consistent manner was a challenge. They undertook a condition survey with surveyors on the properties. It took the surveyors on average 4 hours to survey each unit. There
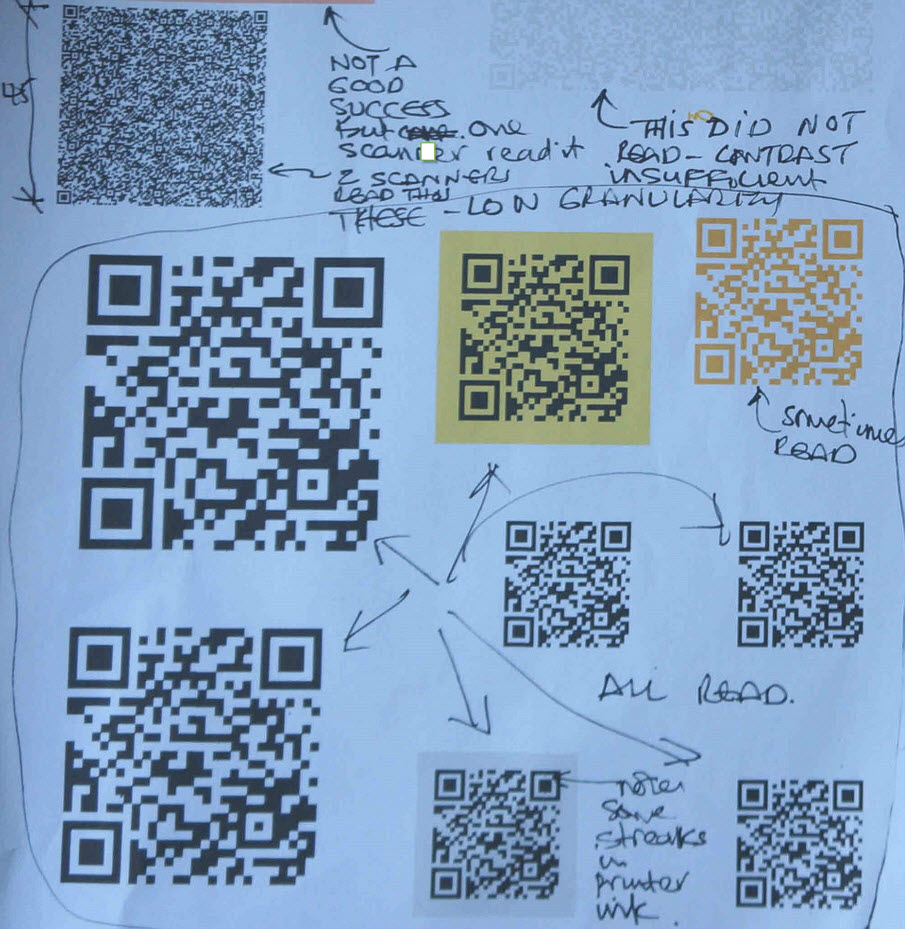
Note: a QRcode reader would be useful to read the codes to understand the usefulness of accessing data for Facilities Management. After capturing data about buildings, the information generally gets stored in an AMIS (Asset Management Information System) for use for forecasting and managing assets. These systems are usually sophisticated and not easily used. There
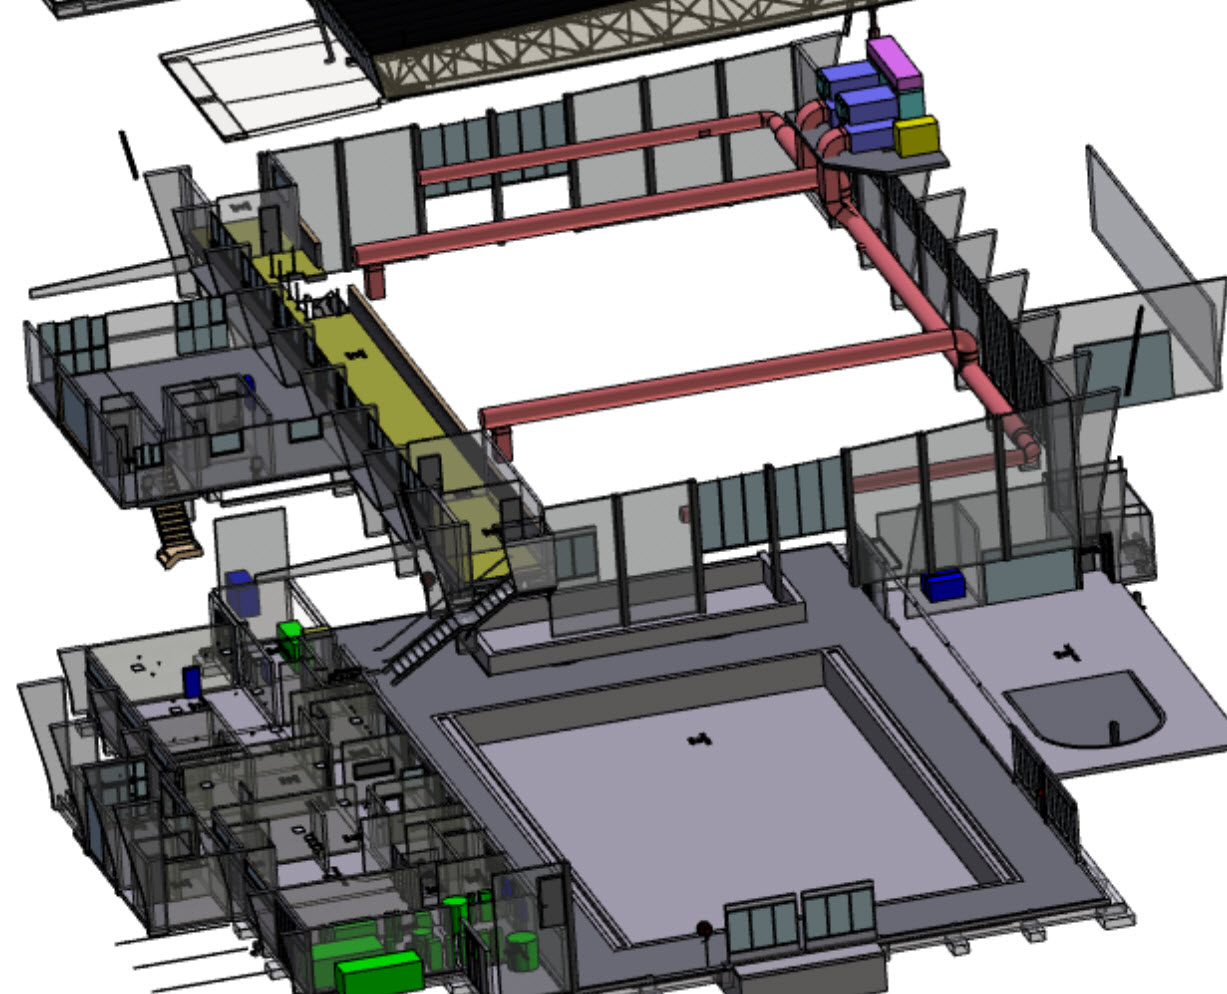
In the first article here regarding capturing building services data on existing buildings, the focus was mainly on discrete components that sit in a system, with for instance lights, there may be an issue regarding which circuit they are linked to which switch or circuit fused in a sub-board, and this could easily be added
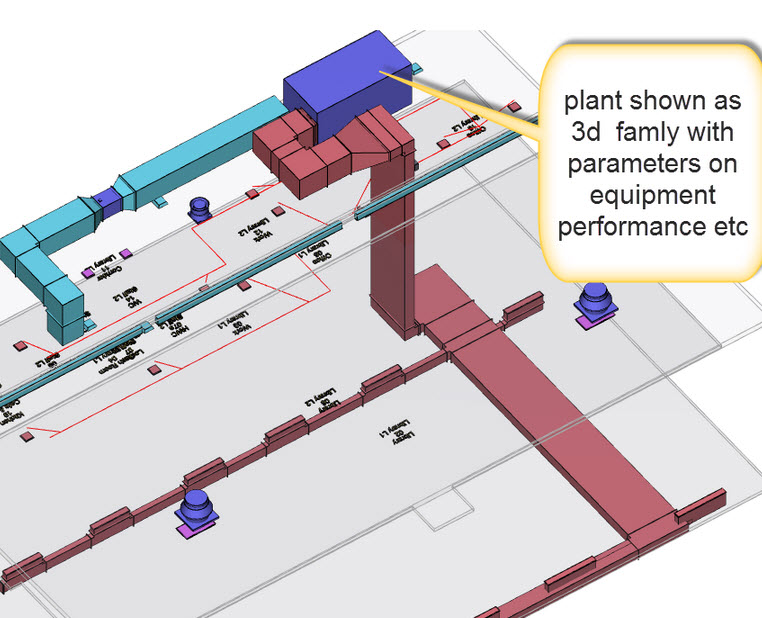
For new assets, if BIM models are used for design/construction then the modeled services are available for use in FM stage of the project. If there are existing assets that are partially through their lifecycle and services data is required for them, then you will need to consider the level of information that you require
Interactive exploration of Data Tableau Public After the first static processes of expressing Condition over time on a map Part 1 I explored using Tableau Public for creating an interface for users to explore the data. The House Conditions in Tableau demonstration allows for users to explore the data in a number of ways and
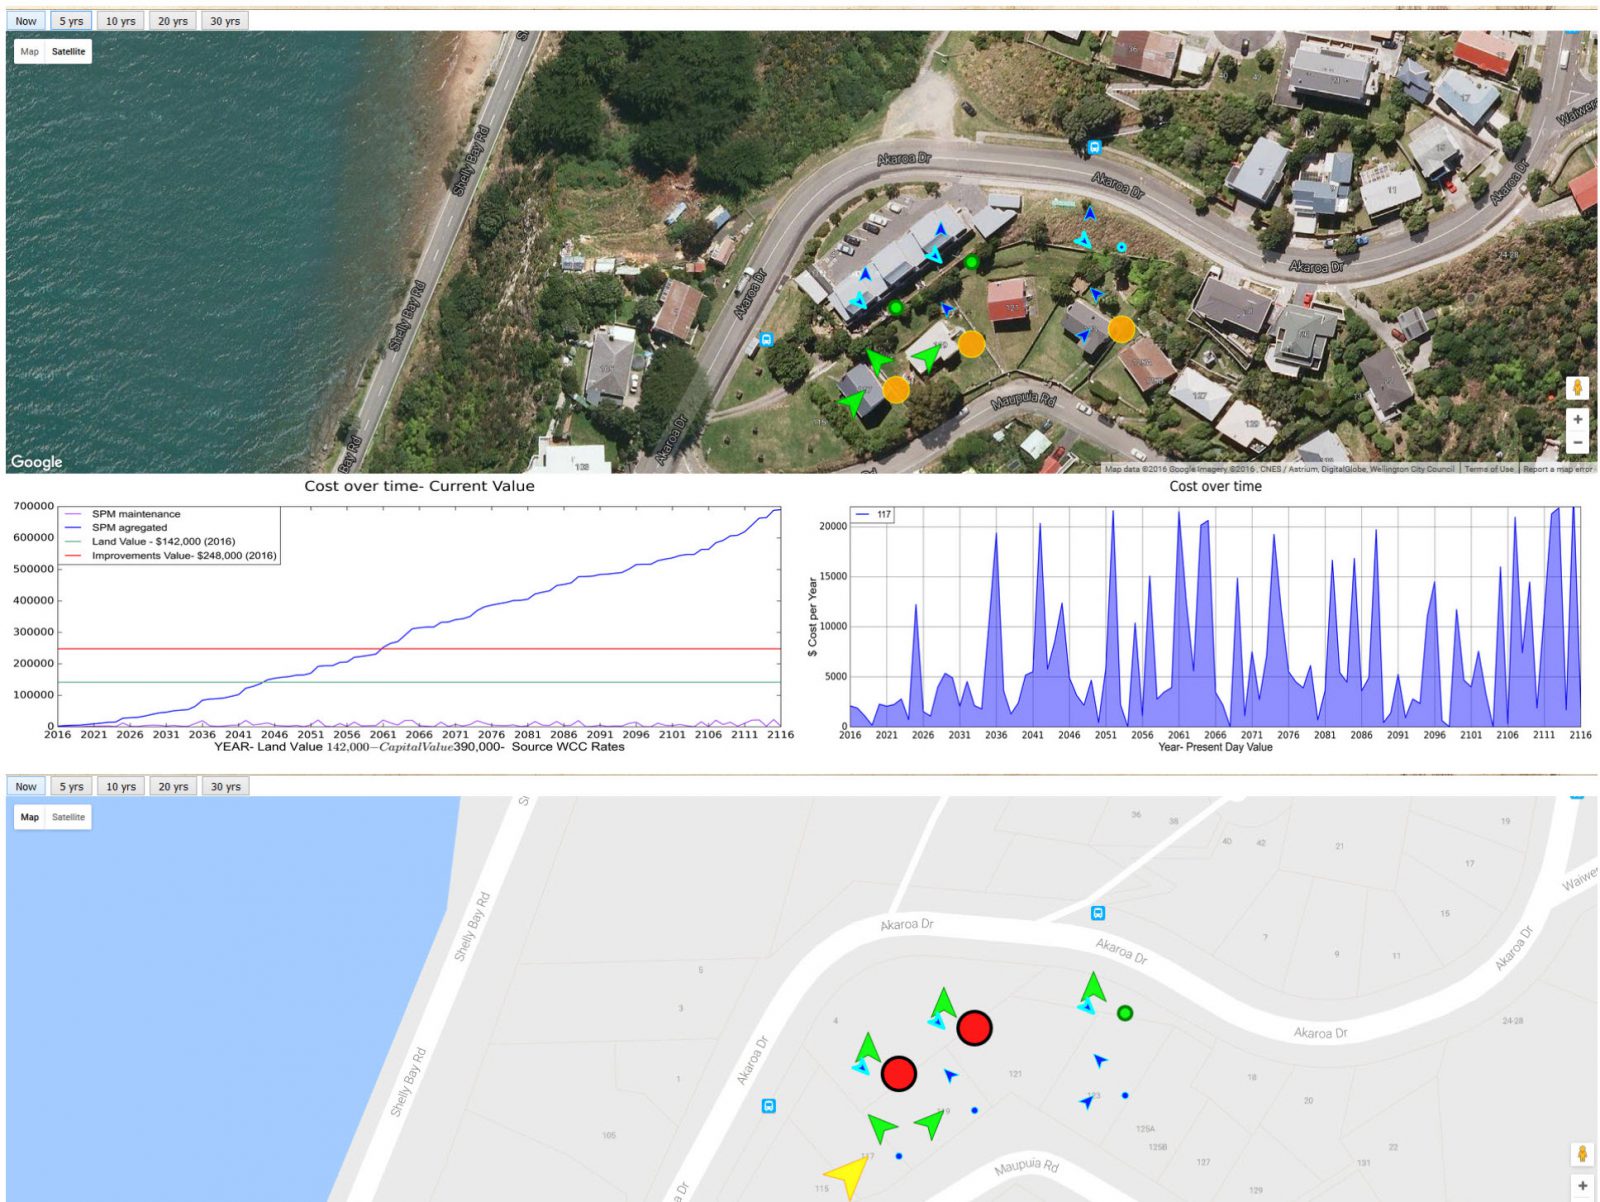
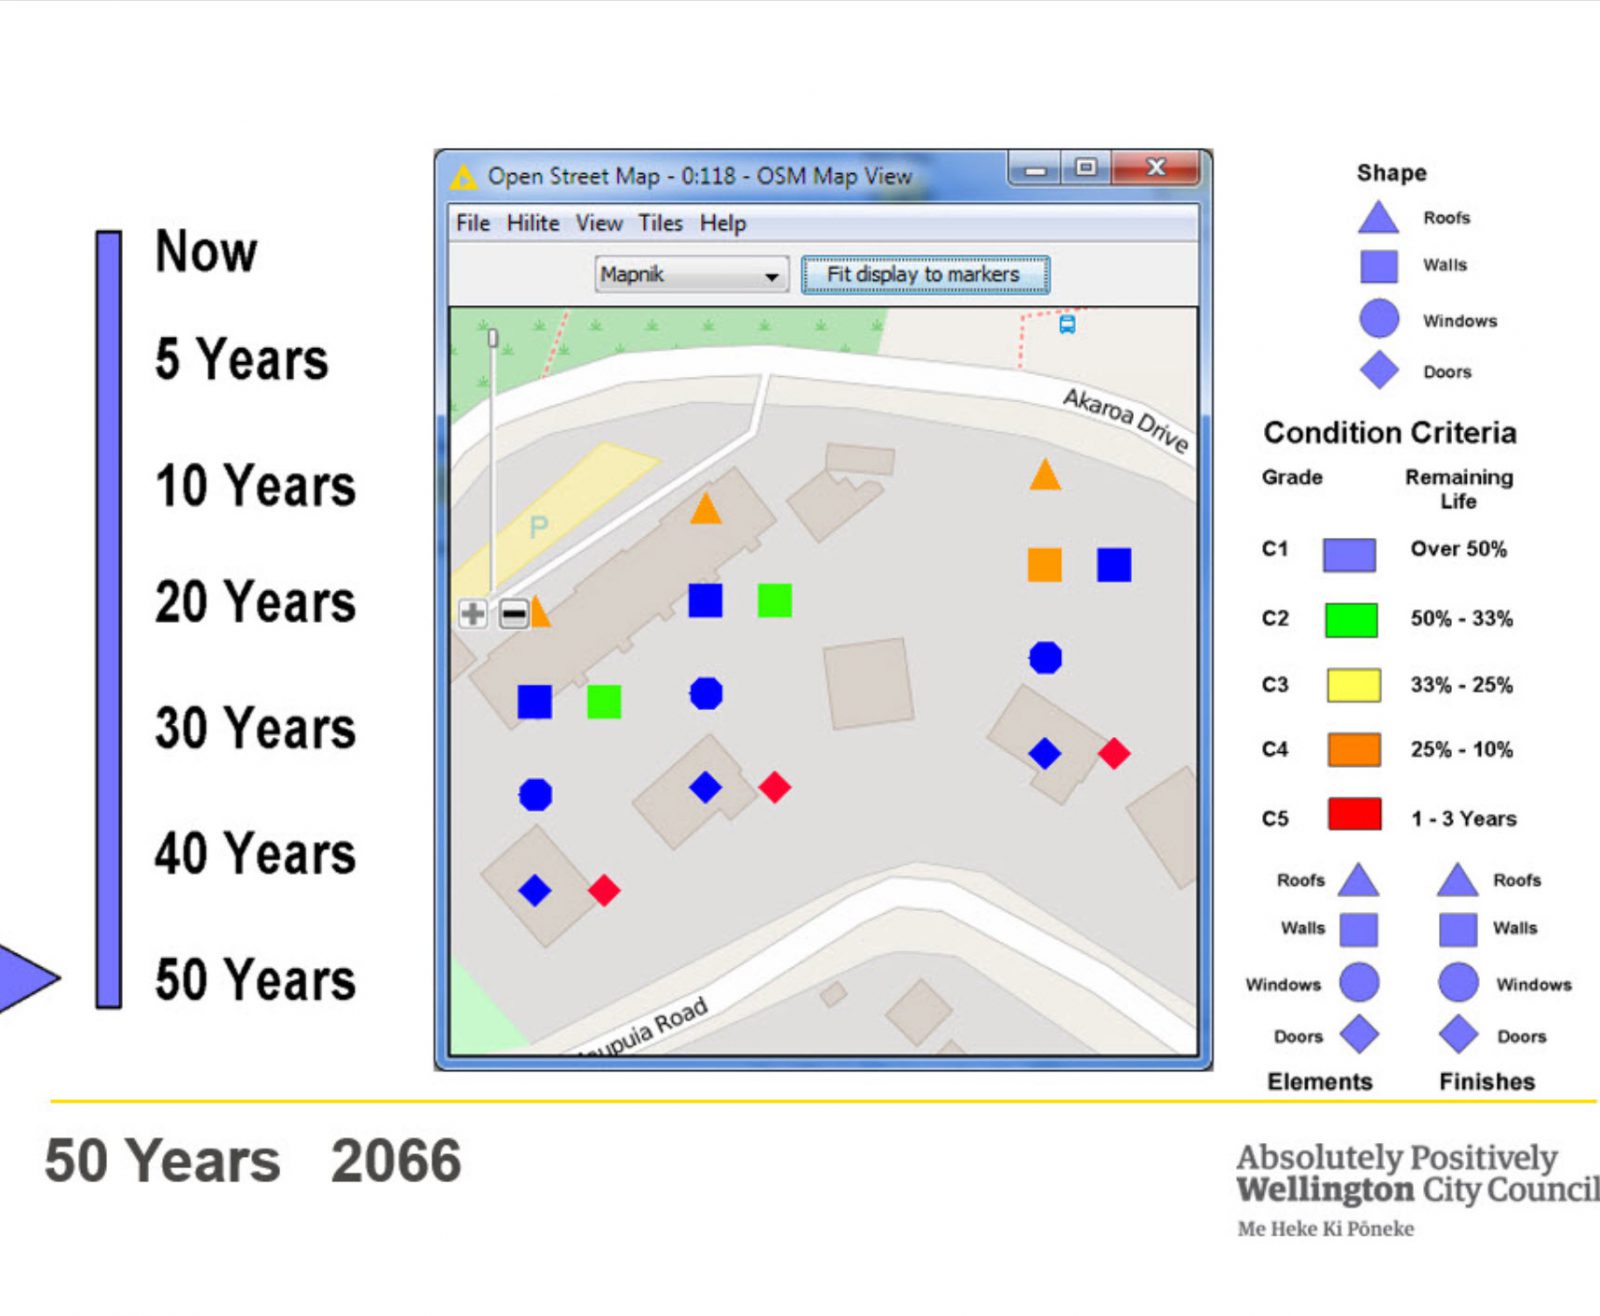
Visualization of geographic building elements Using the same dataset as the Revit internal Condition over Time , I wanted to explore how it could be used geographically to describe the diverse buildings and their locations around the city. QGIS One of the first things was to plot the buildings on a map. For that I
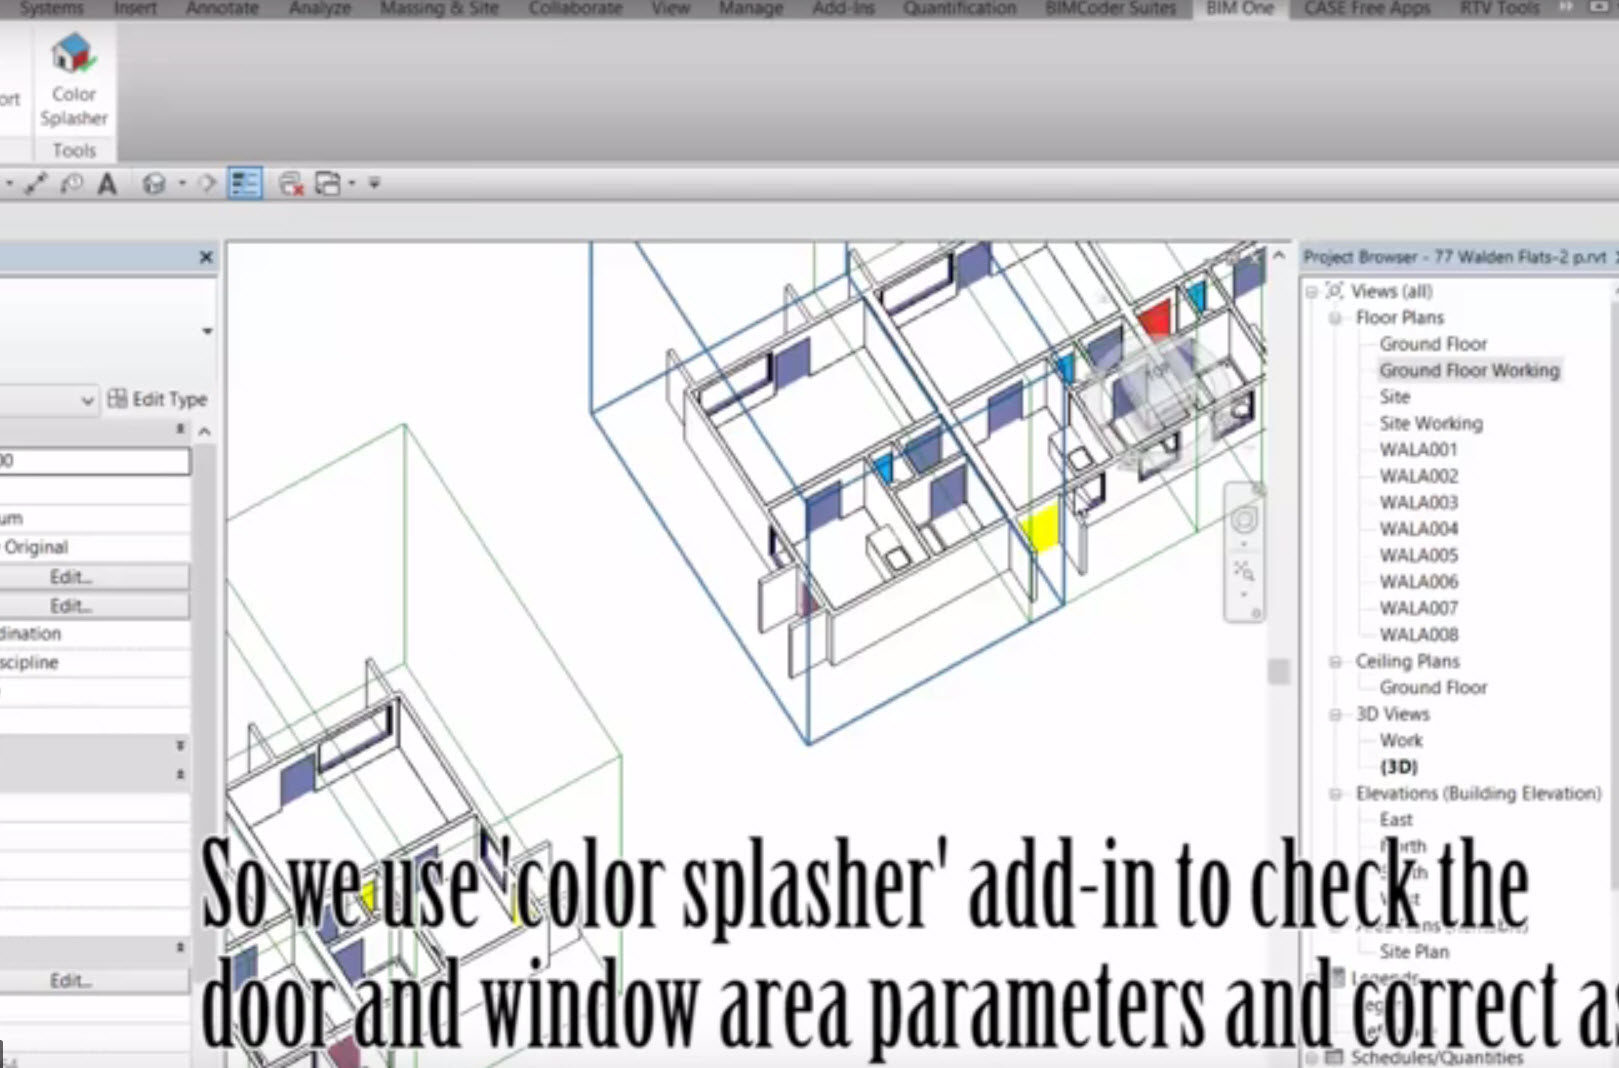
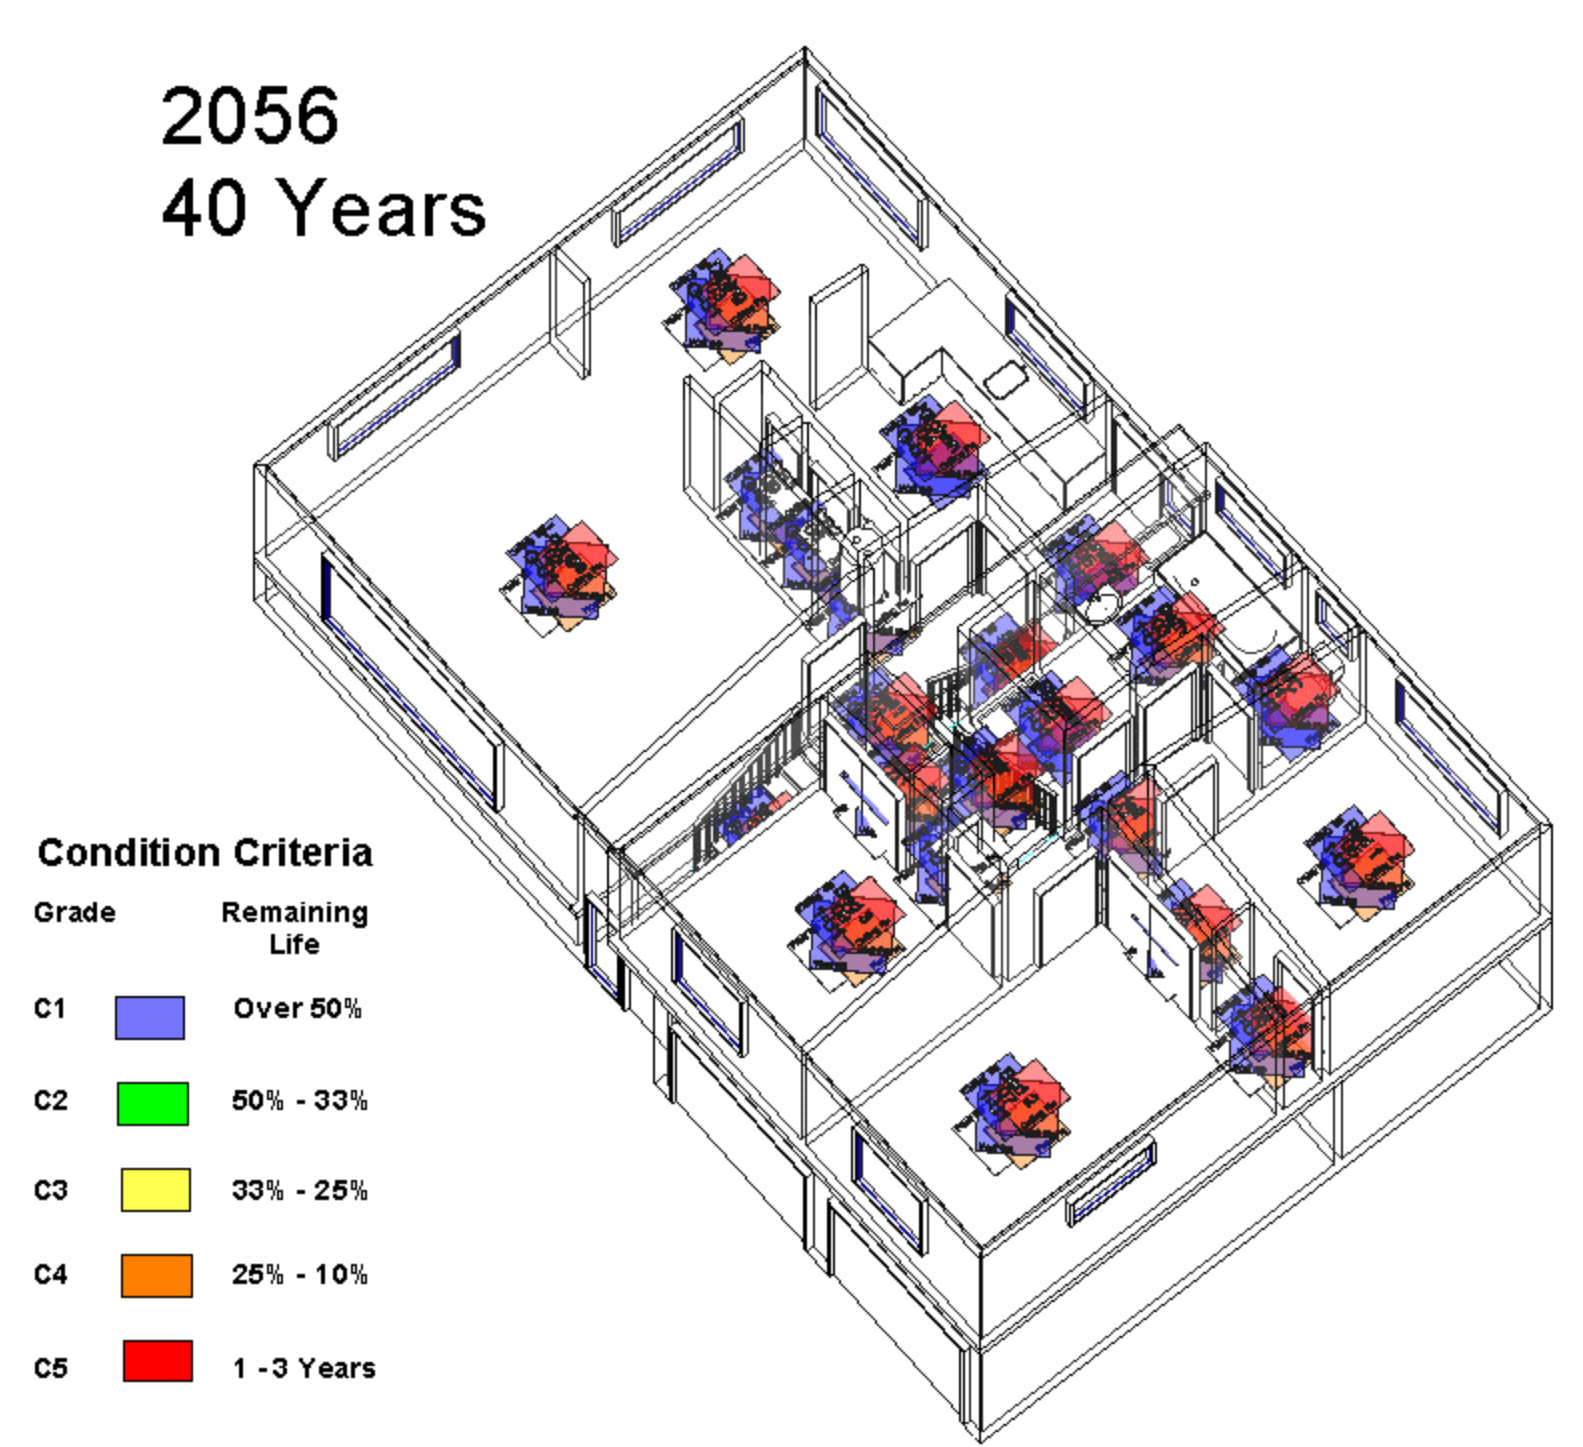
Visualizing condition over time for room finishes When shopping for fresh food, it has a use by date. Depending on when you purchase it, there is a count down to when it has reached its fitness for purpose. So, with a building, things depreciate over time, with different components or finishes lasting for different duration’s
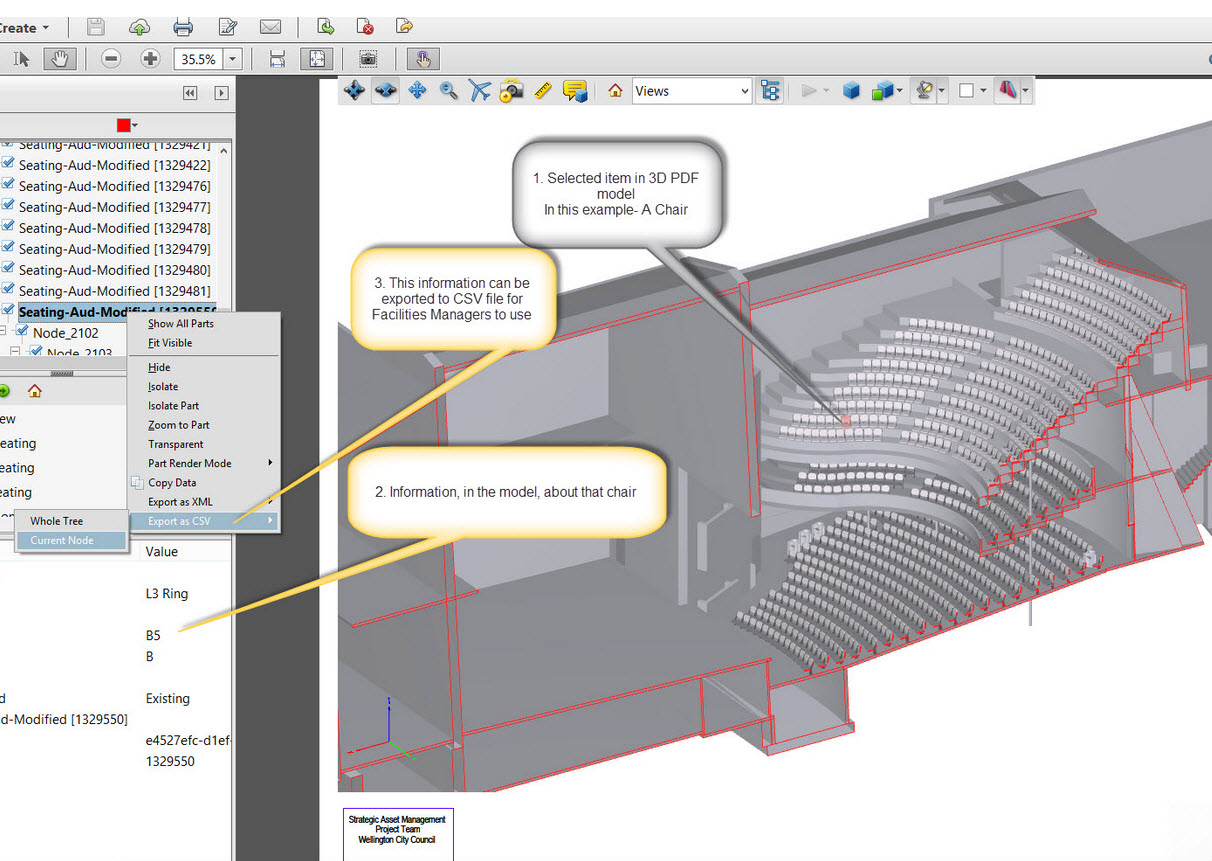
Revit to 3D PDF’s & Export to Excel For designers and contractors, working on the same documentation process, having expensive or specialized software for communication is part of the process. But in the FM/AM world, a lot of people who will be using the information will not want to download specialist viewers to review information.
Google Earth allows you to place your 3D models onto the Earth.(Prior to 2012 they allowed these models to be uploaded publicly but have since stopped that, so there are a number of 3D models inside Google Earth). From Revit you can export the model using the Free Lumion Collada Exporter. These can then be
I printed out some of the QR codes using an inkjet printer for testing. I had a variety of results with the QR code readers I used on both my Windows 10 phone and Windows 10 tablet (so all apps/programmes were free windows based, not tested with IOS or Android Apps). With iOS and Android