BIM back capture Building Services Data Part 1 -Components
For new assets, if BIM models are used for design/construction then the modeled services are available for use in FM stage of the project.

If there are existing assets that are partially through their lifecycle and services data is required for them, then you will need to consider the level of information that you require to:
1/ be put into the model
2/ to what level of complexity
- Speed up the tedious stuff and enjoy designing and documentation more
- Works in all versions of Revit
- Information to PROVE your increased speed
For Plumbing/Hydraulic services, fixtures and fittings can be easily placed into a simplified BIM model easily. For running of reticulation piped services as long as there is a schematic and line diagram showing routes and sizes this may be sufficient. Embedding (if available) the pipework schematic into a combined 3D & 2D PDF document identifies systems, routes and where fittings are located.
For Electrical Systems, Incoming Mains cables, meter boxes and sub-boards/fuse boxes and light fittings may be sufficient. This gives you locations of components and a count for the number of fittings. These combined with a wiring
Power outlets/Data outlets can easily be distributed around the model if required.
Fire sprinklers and bells, alarm buttons, fire extinguishers etc can also easily be shown
As a lot of these services are either embedded in ceilings or in ceiling spaces its sometimes hard to pick the relevant information out.
Inside Revit there are a number of things that can be done to accentuate the building services information:
1. Colour items to highlight them, to make them stand out (filters) and
2. Displaced Views. This splits views so that you can pull layers apart to highlight a specific area.
3. Isolate the specific service with the building background transparency adjusted.
Saving these views to 3D PDF’s allow services to be clearly seen and accessed easily.

The view above show the 2 floors displaced and components linked to one or other of the levels (note vertical duct linked to ground floor view and some roof duct in ground floor view) This was a preliminary exercise to explore ways of representing information so it is a little rough.
The view below shows how categories were split and transparency used to conceal thinks like roofs and ceilings to highlight services.

The displacing of the views needs to be done manually, but the filters for colouring components and transparencies of categories (walls, ceilings, roofs etc) can be preset in Revit View Templates so that it becomes automatic, allowing to quickly create specific views that highlight components.
For the above views I would take these further and only show one service at a time (lighting, security, power, hydraulics, HVAC) to clarify the views and make them quick and easy to use in the 3D PDFs. Click here for link to Services file.
(Note. For link this opens in web browser, but blank view, you need to down load file and open it in adobe reader. Also note, there are 8 pages in this file as these are all separate setup views of different services (not the same view sliced and diced but separately generated 3d views that are exported to pdf).
Because these files can get quite large, maybe it would be easier to split them into separate services files (Electrical,/Plumbing/HVAC etc)with only one joint coordinated view in each separate file (to see issues of coordination).
As per the discussion of extracting data from 3D PDF’s to excel via macro here, the macro sheet has controls for looping through all the services information and exporting to a new sheet.Thereby making the inputted data in Revit available for people only having access to PDF viewer and Excel.


Also , you could put the specific plant data on a QR code on the piece of equipment to make that data available on site. See here for QR code topic and here for examples.
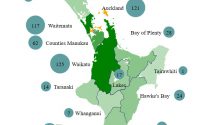
Covid by region NZ -map representation- Part 5

Free Glide app for Honey product sales at market stall, YouTube thumbnails & Glide email notifications