Visual Asset Strategic Tools. Capture Building Information for Building Life Management. Open Source/Low Cost Technology Solutions for you to control your buildings
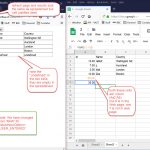
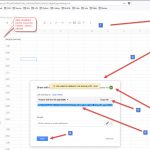
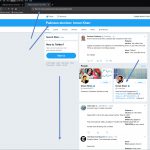
Following on from the previous post I want to try and be able to update a Google Sheet from a web page via the link. I will be following this video: Unfortunately there is not a link to code for this addition, unlike videos 1 & 2 so I’ll need to write it from looking
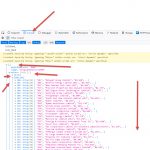
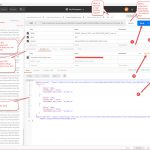
I like it when I find some useful code and it works straight away. When it doesn’t I end up spending an awful lot of time trying to figure out what is happening. turning the programmers dark magic into something comprehensible. Continuing on from the previous post I started to look at the output and
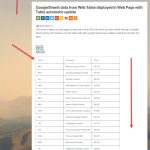
Getting data from the web and being able to manipulate it and display it on your own website. Using Google sheets to refresh the data at specified intervals allows you to get live feed from sites that do not have an API for drawing the data down. At the end of the last post I
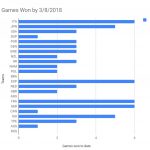
My son in law, Karl Reece is playing in the Canoe Polo 2018 World Championships Welland Canada for team USA. I am very impressed with his accomplishments. Come on USA & NZ. Games played, won/lost based on Groups in table below at the end of 4/8/2018 at Canoe Polo 2018 World Championships Welland Canada. I
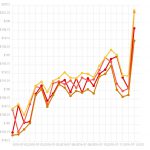
The last few posts have been looking at data from the Web into Excel or using API’s. Then doing some graphics with the data. Excel is a bit static. You have captured the data from the web and you have to send someone your workbook to view. They may not update the data, so it
After Stock Data 2. Graph in Excel from Web and Graph from API to web page I had got the Excel Graph working but had fudged the API to Graph process. So, back to the interwongle, and this time I asked Mr YouTube. I got a bit of a lead on using Chartist.js to display
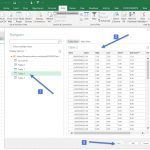
I started looking at getting financial data from the Web, looking at the NZX (NZ stock Exchange) but no-one had free API’s. Actually Quandl did but it was only monthly on overall stocks/bonds and stops the previous month. So I spent a little time fluffing with their free API before realising that was the case.
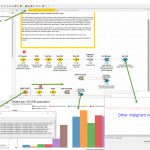
In Knime you can go to the EXAMPLES from the Knime Server in the KNIME EXPLORER Tab and open/save to local workspace some examples to play with. You may need to see about getting some API keys for the examples. I tested Translate using Google API Example. I needed an Google Translate API key and
The above image is for LinkedIn viewers as the API doesn’t seem to fire when viewed from linkedIn. Go here to see web page where the API displays the information. There is also an Extended page with weather & forecast for Wellington, NZ, London, UK & Boston, Ma, USA. Find it here. Output from API
There is a lot of data that can be linked to via API’s (Application programming interface’s), so I’m interested in how to hook up to them to be able to use “GET” requests to download specific data (rather than downloading all the dataset). My first attempt was using Python & Stats.NZ API. I got a