Shares Data 1. Capture via API and Excel from Web
I started looking at getting financial data from the Web, looking at the NZX (NZ stock Exchange) but no-one had free API’s.
Actually Quandl did but it was only monthly on overall stocks/bonds and stops the previous month. So I spent a little time fluffing with their free API before realising that was the case.
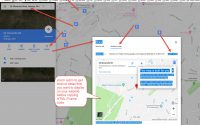
So I looked at grabbing data from the NZX web page using Excel to grab data. I ended up setting the Main Board NZX table up quite easily.
I then looked at a couple of other sites for a free API and then found the Yahoo financials pages, and as I was hunting around for some sort of API for that I ended up getting distracted by the weather App connection and built this page that displays weather for Wellington, London & Boston. Pretty raw javascript coding but it delivers the essentials.
That sort of distracted me from trying to find how to connect to the Yahoo API and then found that that has been stopped and tried using the Yahoo Query Language (YQL) to get data with no success and then came to StackOverflow article on YQL that pointed to Alpha Vantage that has a free API key for financial Data. I have tried with test for FBU.NZ Fletcher Building Unit with call :
https://www.alphavantage.co/query?function=TIME_SERIES_INTRADAY&symbol=FBU.NZ&interval=1min&apikey=your_api_key&outputsize=full
This is at 1 minute intervals and pulls the data through, but:
{
    "Meta Data": {
        "1. Information": "Weekly Prices (open, high, low, close) and Volumes",
        "2. Symbol": "MSFT",
        "3. Last Refreshed": "2018-07-27",
        "4. Time Zone": "US/Eastern"
    },
    "Weekly Time Series": {
        "2018-07-27": {
            "1. open": "106.3000",
            "2. high": "111.1500",
            "3. low": "106.1300",
            "4. close": "107.6800",
            "5. volume": "155109495"
        },
        "2018-07-20": {
            "1. open": "105.4000",
            "2. high": "108.2000",
            "3. low": "103.8900",
            "4. close": "106.2700",
            "5. volume": "173393038"
        },
        "2018-07-13": {
            "1. open": "101.6452",
            "2. high": "105.6000",
            "3. low": "101.1000",
            "4. close": "105.4300",
            "5. volume": "106139197"
        },
        "2018-07-06": {
            "1. open": "98.1000",
            "2. high": "101.4300",
            "3. low": "98.0000",
            "4. close": "101.1600",
            "5. volume": "72446825"
        },
        "2018-06-29": {
            "1. open": "100.0000",
            "2. high": "100.1100",
            "3. low": "97.2600",
            "4. close": "98.6100",
            "5. volume": "148332848"
        }
Grabbing the data will be a challenge as its dated for the variables, so I need to think about how to manage that aspect of the data. But at least I have JSON data to work with.
The documentation for Alpha Vantage is quite readable and makes sense , and there are examples at the bottom (rare for it to be so easy) . Also the community link was a good pointer on how to get non american share data. So I will need to do some more work on this.
Excel from Web process
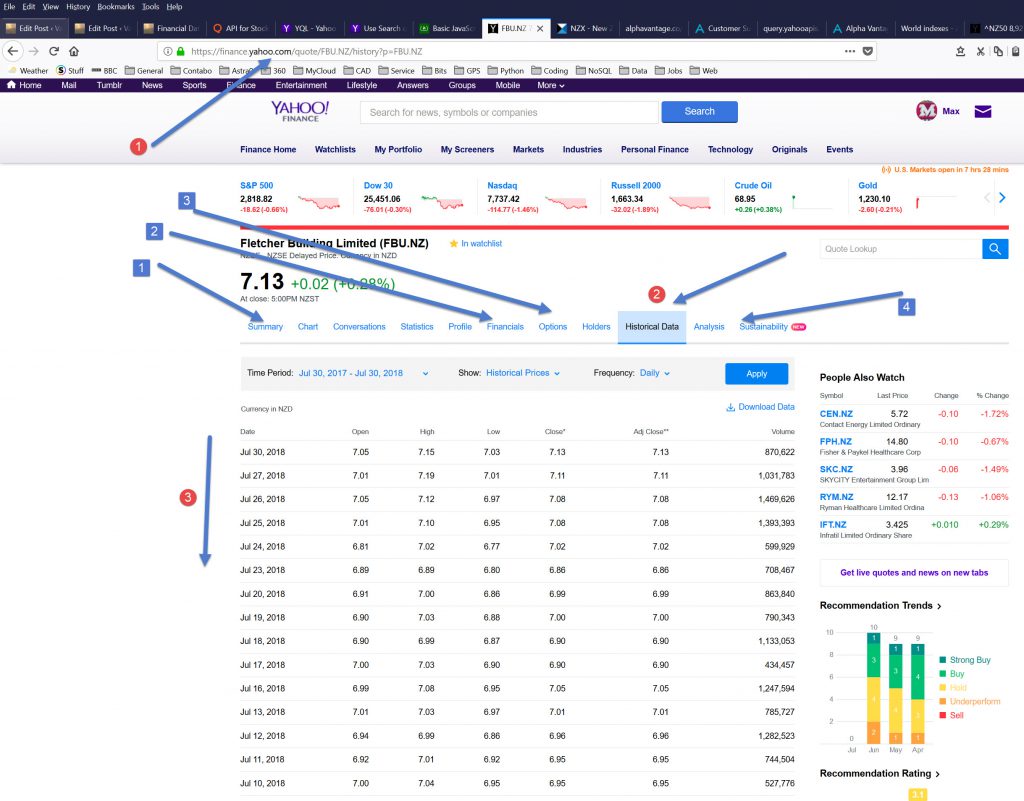
This is done with the Yahoo Fletchers Building Unit Shares (I’d previously done the same table from NZX, but for this demo decided on Yahoo). Actually the Yahoo data is better as it has historical data that is easily accessed. Was not so obvious on the NZX website.
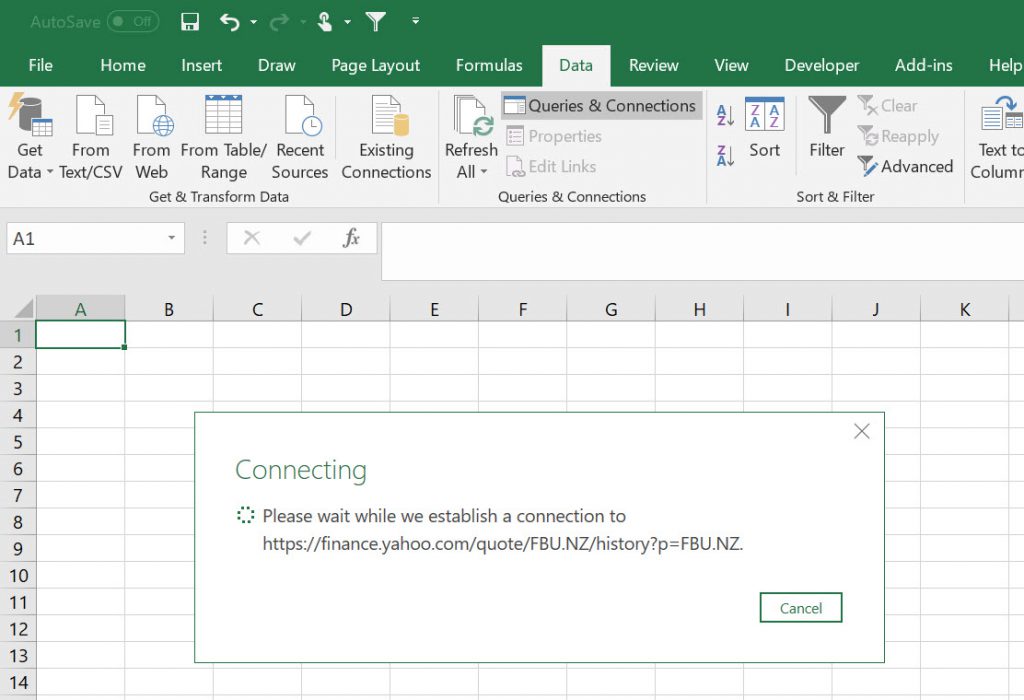
Open Excel, go to Data Tab and Click on Get from Web Icon and fill in Web page you want to go to.
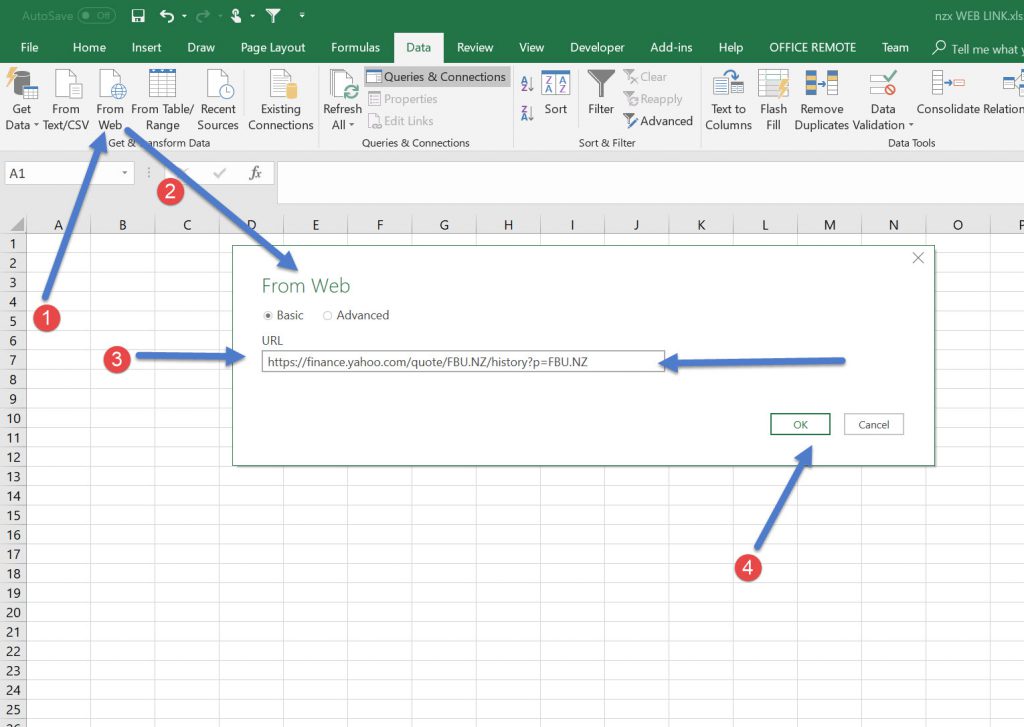
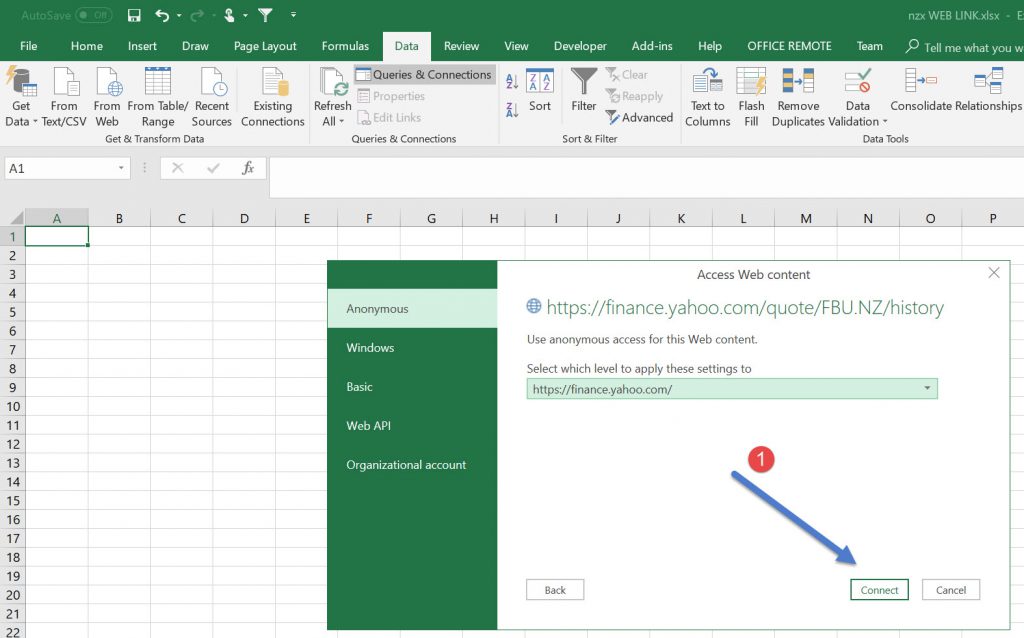
The Yahoo came with this, but there is a choice of putting in your API key if you have one, this site does not require one , so just hit connect with Anonymous.
Excel usually has to think about things, as its processing the site to find Table Data.
In this case I pick Table 2, which is historical data (daily)
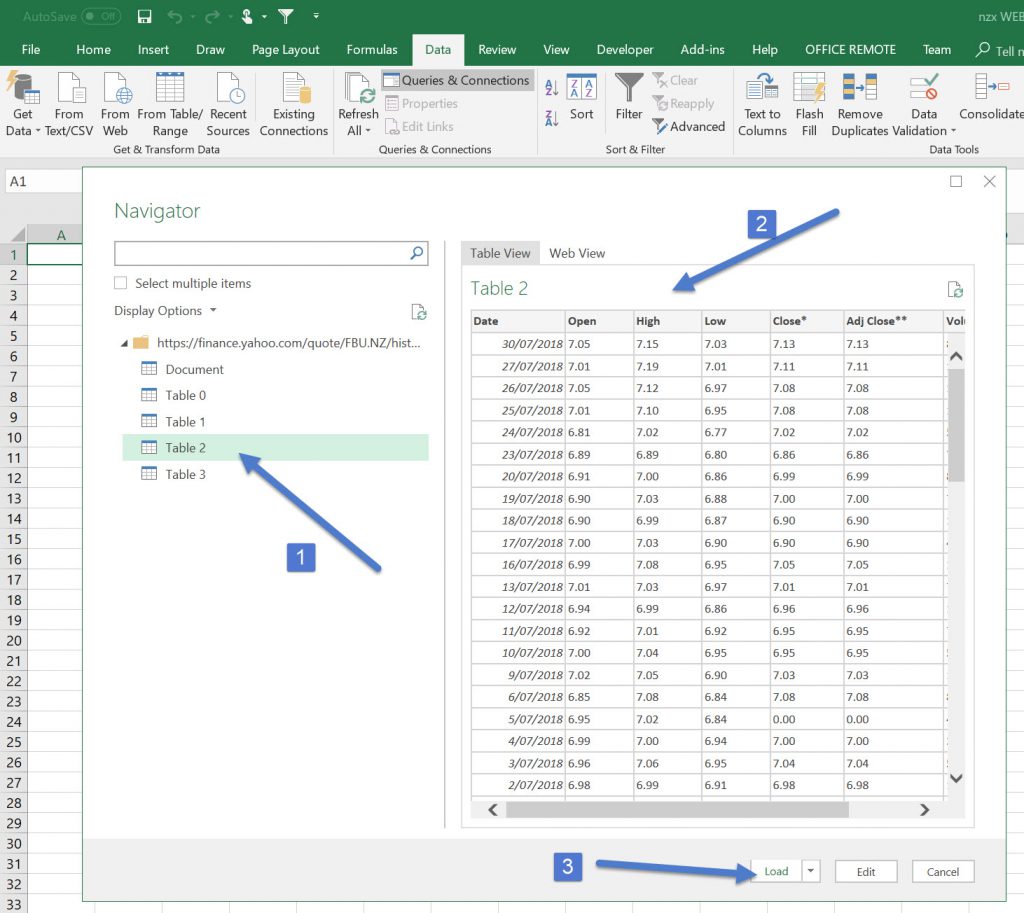
After loading it comes in as a TABLE in Excel (an Excel table, that has certain properties)
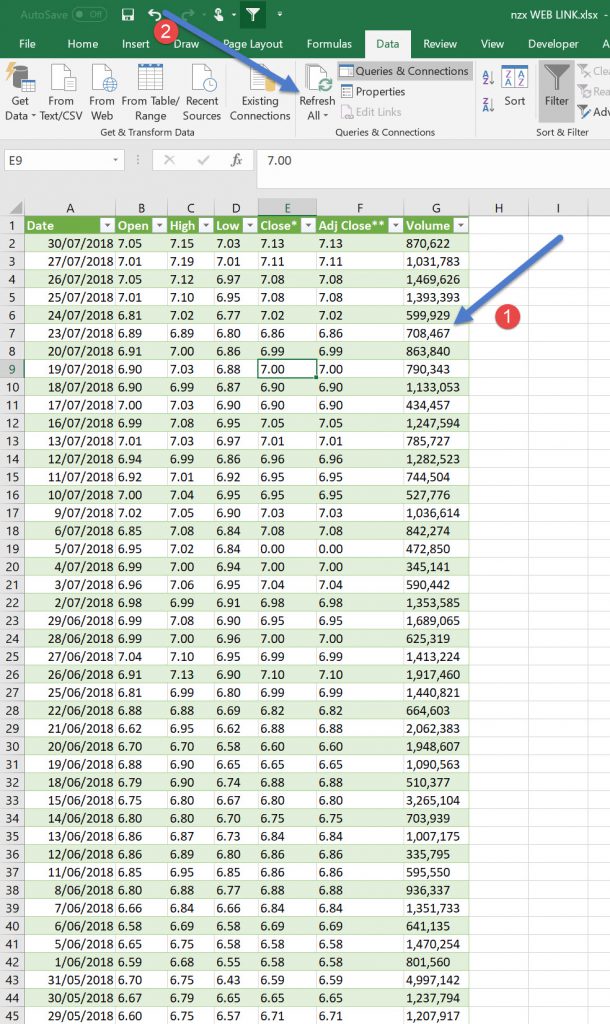
Once in Excel you need to save the file.
The data will be static. If you want to update the data, click refresh and it will go and re-load the data from the website (it will write over what you have already).
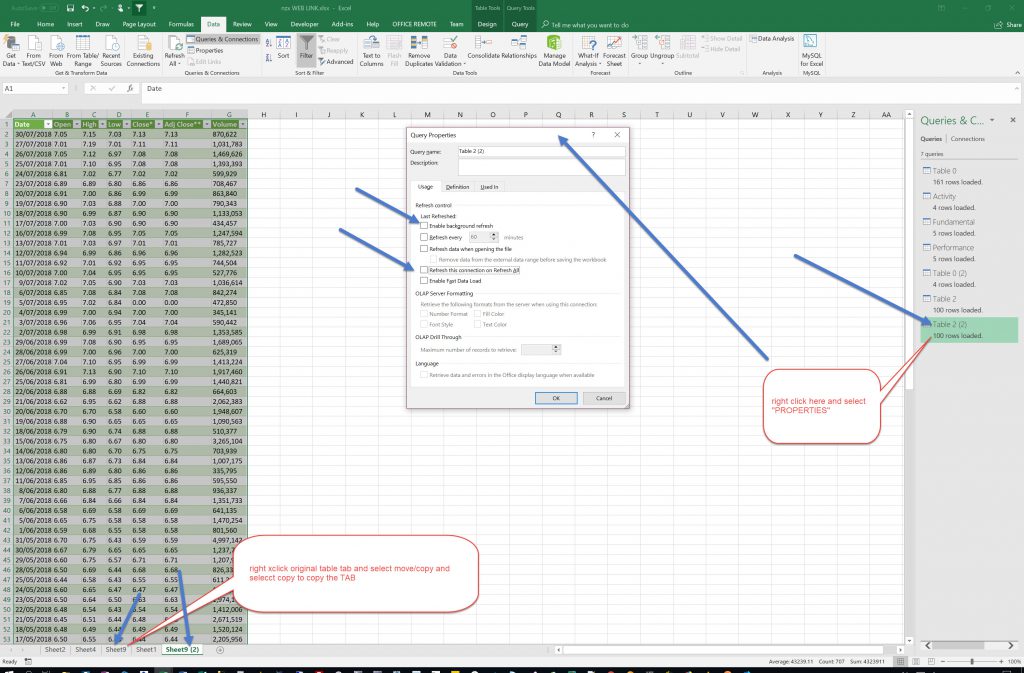
So if you want to save the original data copy the TAB and then go to properties and make sure The Refresh options are unticked otherwise the data will update on Refresh.
A couple of issues:
This process with Excel connecting to the Web looks for tables.
There is an interesting Article here about how to grab Non-tabular data from a webpage. I enjoyed the article but have not personally tested it yet.
There is a timer so that you can get auto-refresh on your data at specific intervals if you want ot update it regularly (you do need the spreadsheet open fore that).
I did see an article where you can send your data to Google sheets (and I think leave them live so they are constantly updating) then use that as the Base to call the information from Google Sheets to your Web Page.
Instead of Excel you could have done this in PowerBI.
End thoughts
I tried to do a quick chart in Excel with the Tabulated data from FBU.NZ and got into trouble. I will need to watch a youtube vid on “how to” to see why doing a chart with a table is not simple.
I will, after finding a free finance API that will look at NZ shares, have a play to see if I can display the data, initially in a tabular manner, then graphically.
Now I’m a bit more confident with connecting to data through API’s, I now need to learn how to wrangle that data so that I can display it in a meaningful manner.

360 panorama free online viewer
Bookmarklets part 2