API 3. Stats NZ, Postman & Quandl
There is a lot of data that can be linked to via API’s (Application programming interface’s), so I’m interested in how to hook up to them to be able to use “GET” requests to download specific data (rather than downloading all the dataset).
My first attempt was using Python & Stats.NZ API. I got a bit of the way along the path for accessing data and then paused.
I am finding trying to get data out of the Stats API is pretty frustrating. There is not really a step by step help file to show how you can use a lot of the filters to drill down into the dataset.
At the end of the first exercise with python I could find a table and some of its data but could not filter it. So I ended up with lots of data but not necessarily the information that I was looking for. I need to be able to filter the data.
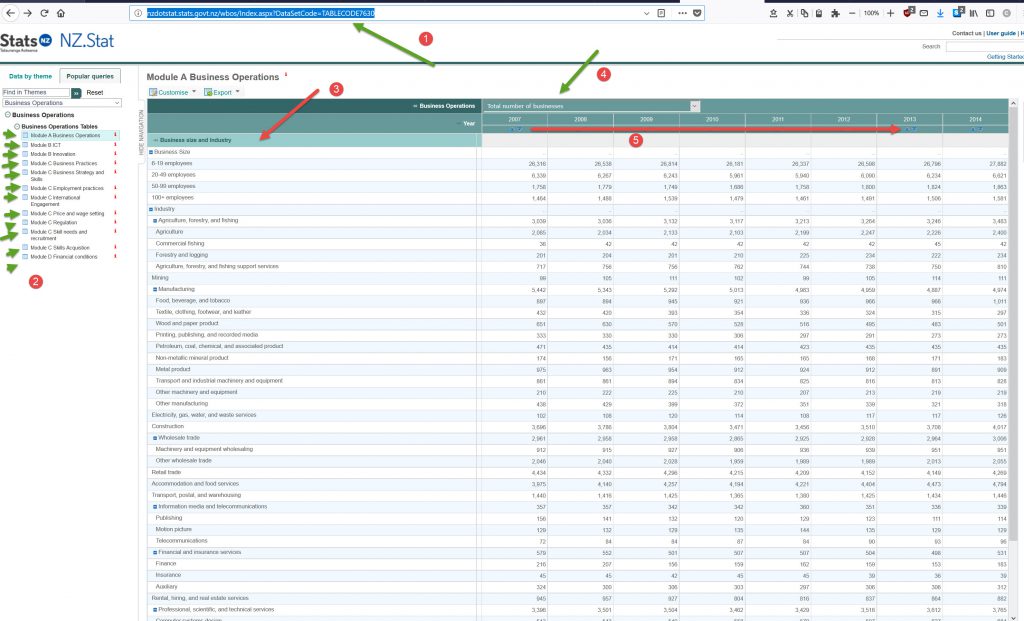
From the end of the last post, using Python, I could go onto the Test Query Page and put in a basic request and get the results.
I can also take the Table name and get the display of the table in the browser by altering the Table name in the URL below:
http://nzdotstat.stats.govt.nz/wbos/Index.aspx?DataSetCode=TABLECODE7630
So how to drill down further to get specific information?
Searching for information on the Stats API part of the website is pretty frustrating. They have a Forum tab that takes you nowhere (“Can’t find” browser result). And there are a few articles in the “Issues” tab, replied to by Mr/Mrs HIDDEN that are of minimal help. The only piece of useful information I have gleaned is that there is a link to the “Filters in Asure” page that helps you do filtering on the datasets. I had previously contacted Stats.NZ on their chat line but the API people never got back to me.
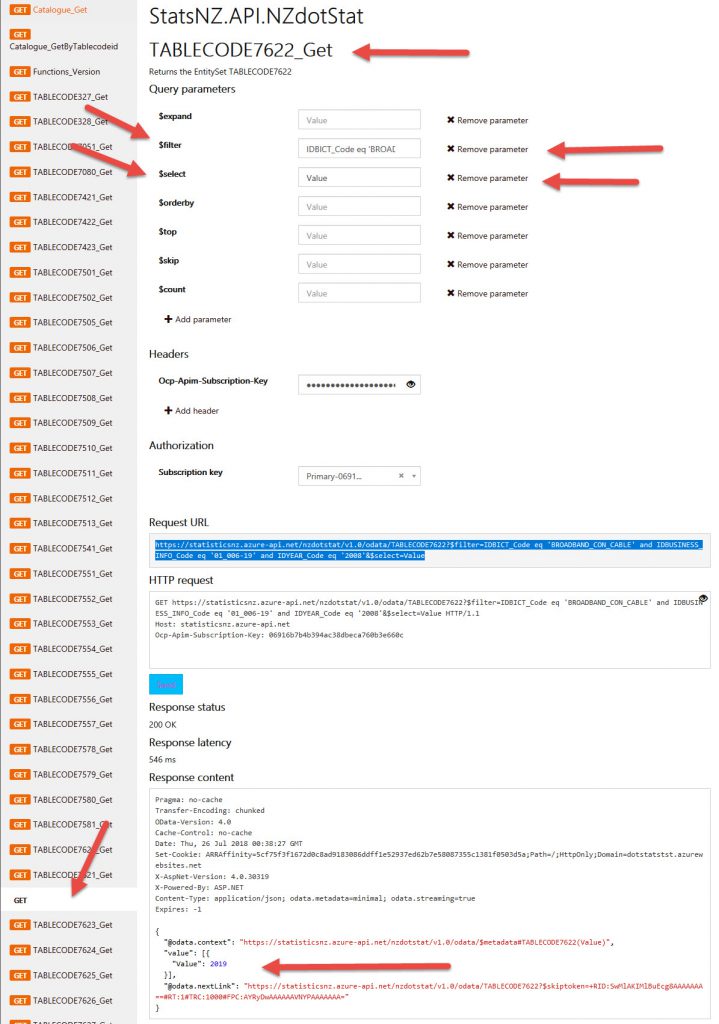
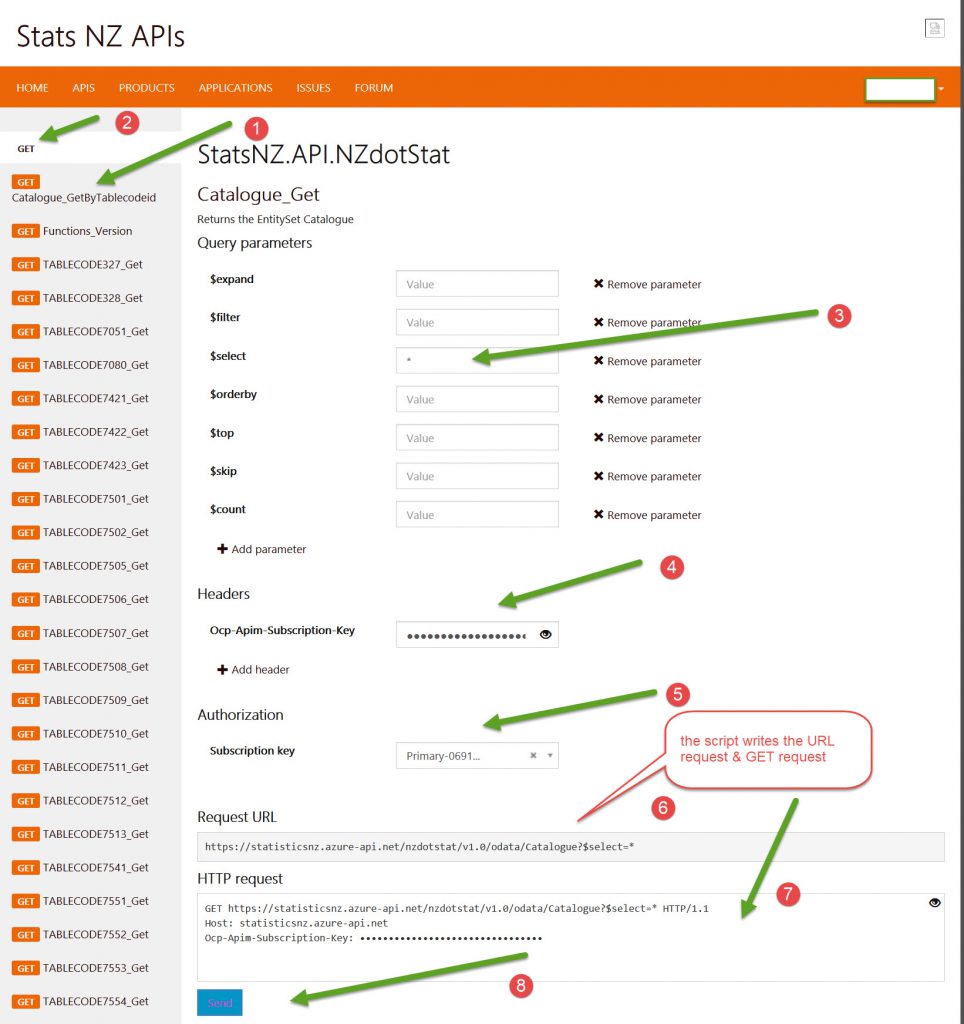
The request string looks like this:
https://statisticsnz.azure-api.net/nzdotstat/v1.0/odata/TABLECODE7622?$filter=IDBICT_Code eq 'BROADBAND_CON_CABLE' and IDBUSINESS_INFO_Code eq '01_006-19' and IDYEAR_Code eq '2008'&$select=ValueThis uses $filter:
$filter=IDBICT_Code eq 'BROADBAND_CON_CABLE' and IDBUSINESS_INFO_Code eq '01_006-19' and IDYEAR_Code eq '2008'
This uses $select:
$select=Value
So far, with the Query parameters, I can use the following:
$expand – (DONT KNOW!)
$filter – (Yes, IDBICT_Code eq ‘BROADBAND_CON_CABLE’ and IDBUSINESS_INFO_Code eq ’01_006-19′ and IDYEAR_Code eq ‘2008 (where you use and/or and eq[equal], ne[not equal], lt[less than], mt[more than])
(NOTE: In the json output the results key pairs are in double quotes:
"IDANSWER_Code": "1",
"IDANSWER_Name": "Yes",
"IDCATEGORY_Code": "2",
"IDCATEGORY_Name": "Visit the hairdresser once every three months",
but for $filters, the attribute (first of the pair) needs to be written without any quotes, and the Value (2nd term of the pair) needs to be in SINGLE quotes!.)
$select– (Yes, see above, for all use wildcard *, or say Value. For multiple attributes use Value,IDYEAR_Code,IDBUSINESS_INFO_Code (a comma!! So why different from filter???)
$orderBy– (Yes, see above)
$top– (Put in number, eg 10 and it will return top 10 lines)
$skip– (Can’t seem to get this to work for some reason, you’d think it would be obvious, say 10 so skip 10 lines, but that doesn’t happen!!!)
$count– (true, then it shows count at top of JSON file)
In the Azure Documentation
$skip=# (optional)
The number of search results to skip. When calling via POST, this parameter is named skip instead of $skip. This value cannot be greater than 100,000. If you need to scan documents in sequence, but cannot use $skip due to this limitation, consider using $orderby on a field that has unique values for every document in the index (like the document key, for example) and $filter with a range query instead.
$top=# (optional)
The number of search results to retrieve. This defaults to 50. When calling via POST, this parameter is named top instead of $top. If you specify a value greater than 1000 and there are more than 1000 results, only the first 1000 results will be returned, along with a link to the next page of results (see @odata.nextLink in the example below).
Azure Search uses server-side paging to prevent queries from retrieving too many documents at once. The default page size is 50, while the maximum page size is 1000. This means that by default Search Documents returns at most 50 results if you don’t specify $top. If there are more than 50 results, the response includes information to retrieve the next page of at most 50 results (see @odata.nextLink and @search.nextPageParameters in the Examples below. Similarly, if you specify a value greater than 1000 for $top and there are more than 1000 results, only the first 1000 results are returned, along with information to retrieve the next page of at most 1000 results.
$count=true | false
Optional, defaults to false. When calling via POST, this parameter is named count instead of $count. Specifies whether to fetch the total count of results. This is the count of all documents that match the search and $filter parameters, ignoring $top and $skip. Setting this value to true may have a performance impact. Note that the count returned is an approximation. If you’d like to get only the count without any documents, you can use $top=0.
$orderby=[string] (optional)
A list of comma-separated expressions to sort the results by. When calling via POST, this parameter is named orderby instead of $orderby. Each expression can be either a field name or a call to the geo.distance() function. Each expression can be followed by asc to indicate ascending, and desc to indicate descending. The default is ascending order. Ties will be broken by the match scores of documents. If no $orderby is specified, the default sort order is descending by document match score. There is a limit of 32 clauses for $orderby.
$select=[string] (optional)
A list of comma-separated fields to include in the result set. Only fields marked as retrievable can be included in this clause. If unspecified or set to *, all fields marked as retrievable in the schema are included in the projection. When calling via POST, this parameter is named select instead of $select.
Results
The results are in JSON format, so if you wish to convert this to tabular information you need to use a JSON to CSV converter, like the online one here.
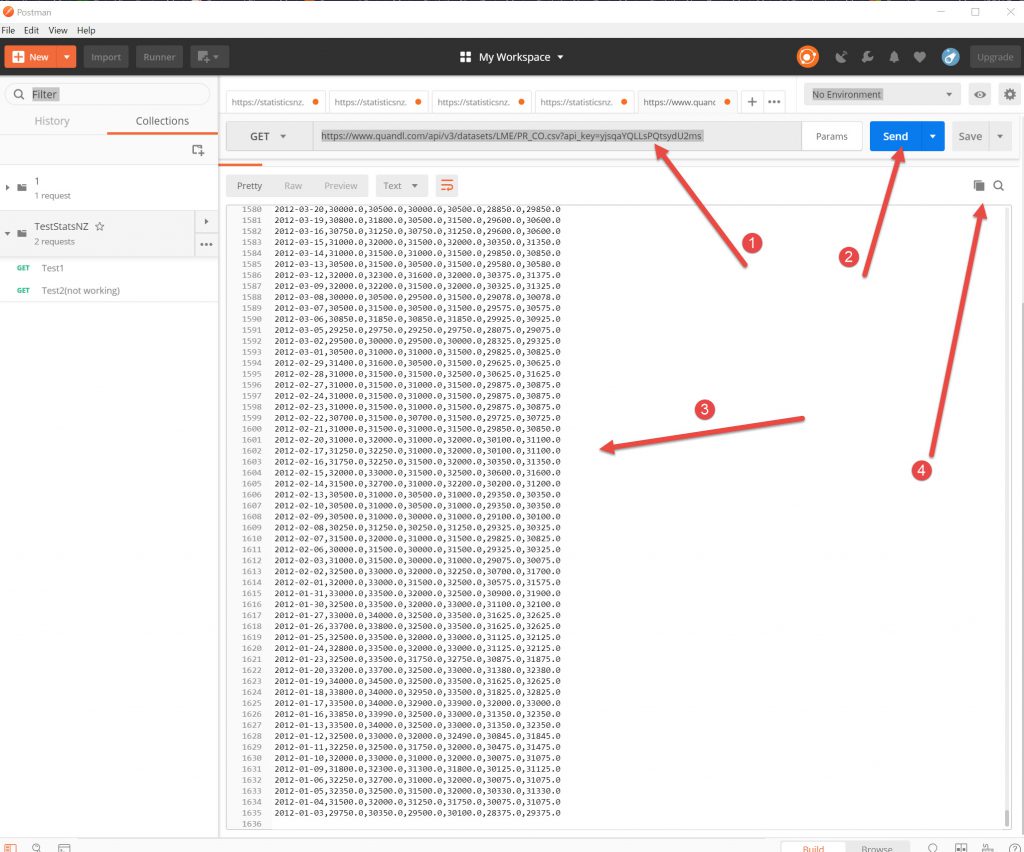
Testing with Postman
Postman is a developers tester for API requests. You can download the free app here. There are different pricing regimes, but the basic one is for free as long as you have under 1000 calls per month. See here for pricing.
The interface breaks down to allow you to add the parameters to filter the data that you want and to test it. So you can keep on adding extra filters or select statements until you are happy with the output.
The header requests can be viewed as Key-Value pairs or in Bulk Edit mode (2nd screenshot below).
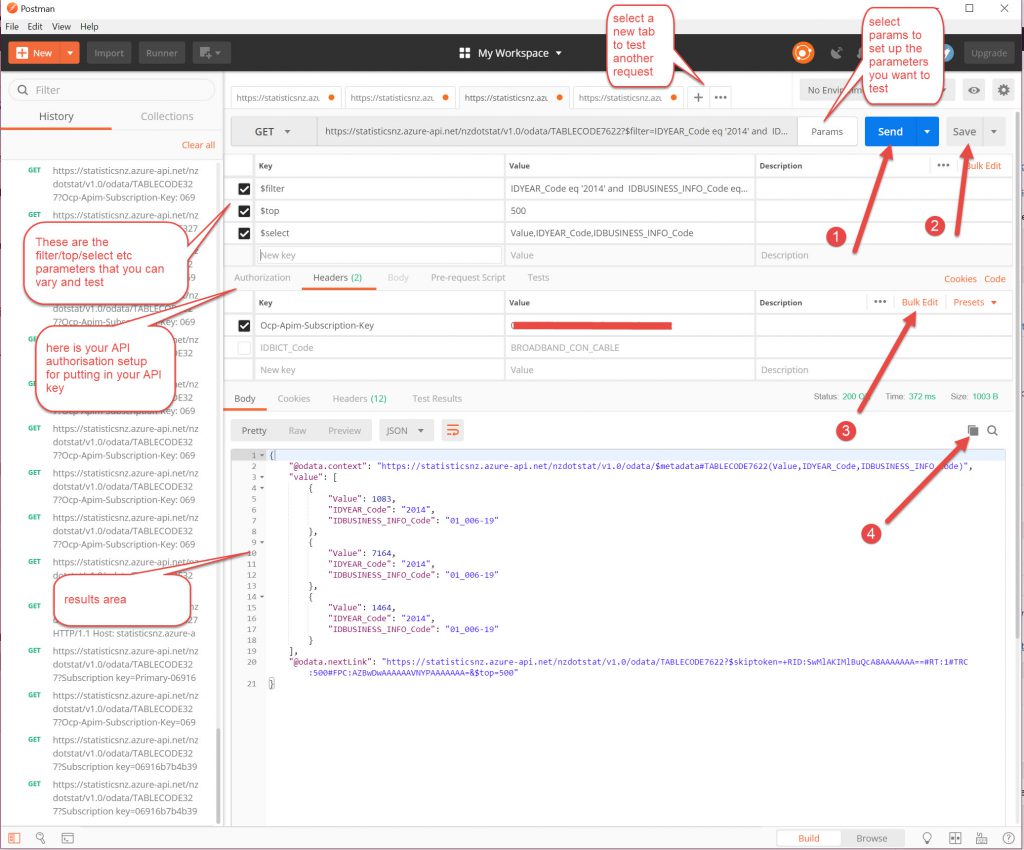
If you have a $filter it has to be all on one line, so you have to have a few and statements to get the filtering that you want. So the Bulk Edit is a better pane to work in for the parameters in my opinion.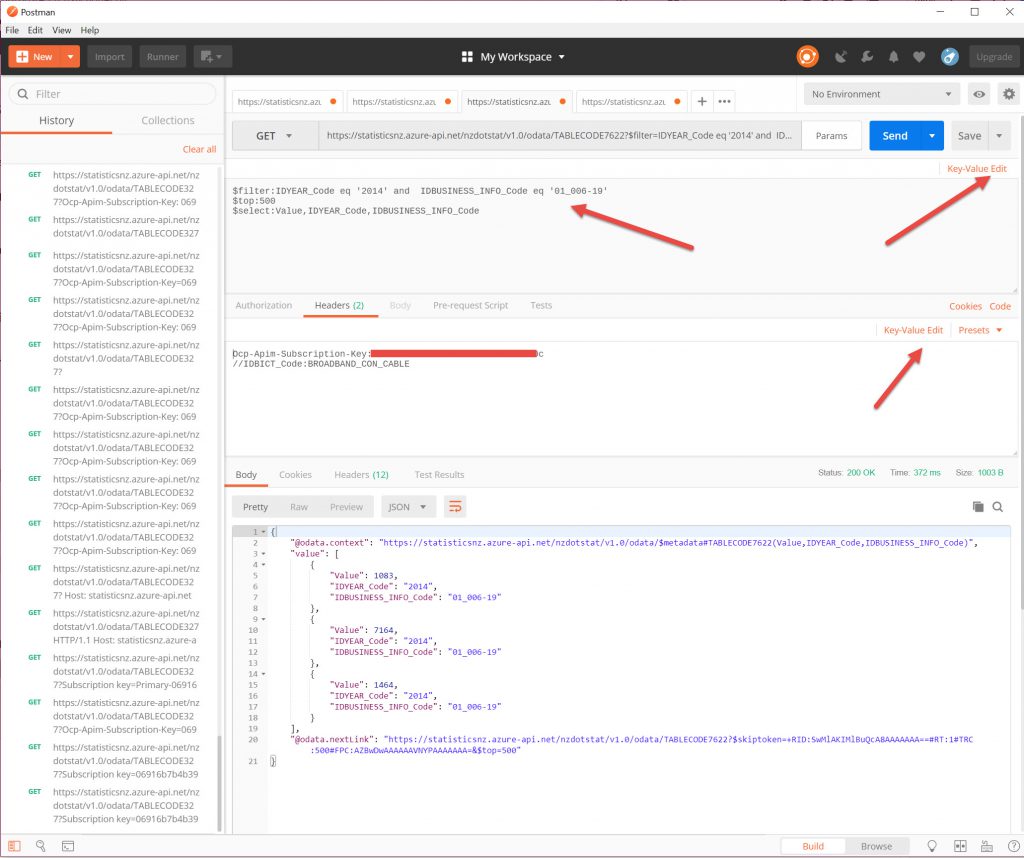
The nice thing about Postman is that it will work with a lot of different API’s not only the Stats.NZ one, and at least you are working with the same tool so can become familiar with the tool rather than a lot of different web sites.
This site was mentioned for finding out about API’s. programmableweb.com. It has an API directory but I note that Google Maps one has been altered and not refined and others I had explored (WHO) did not give the right links to the API setup sites. But a good resource nonetheless.
Back to the Stats exercise
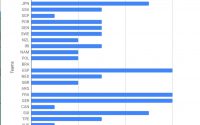
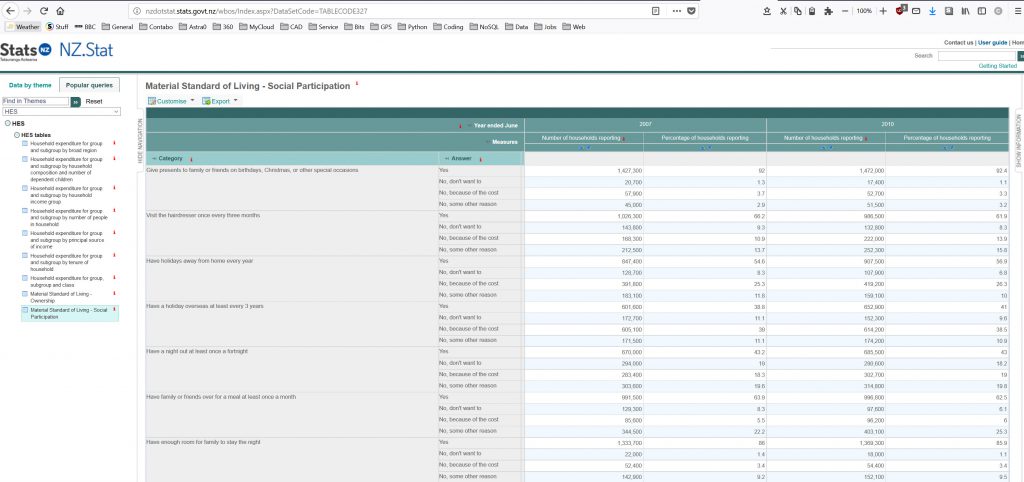
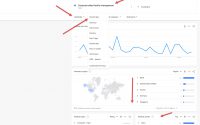
Looking at the table data of table TABLECODE327 it is displayed as below on the Stats.NZ site.
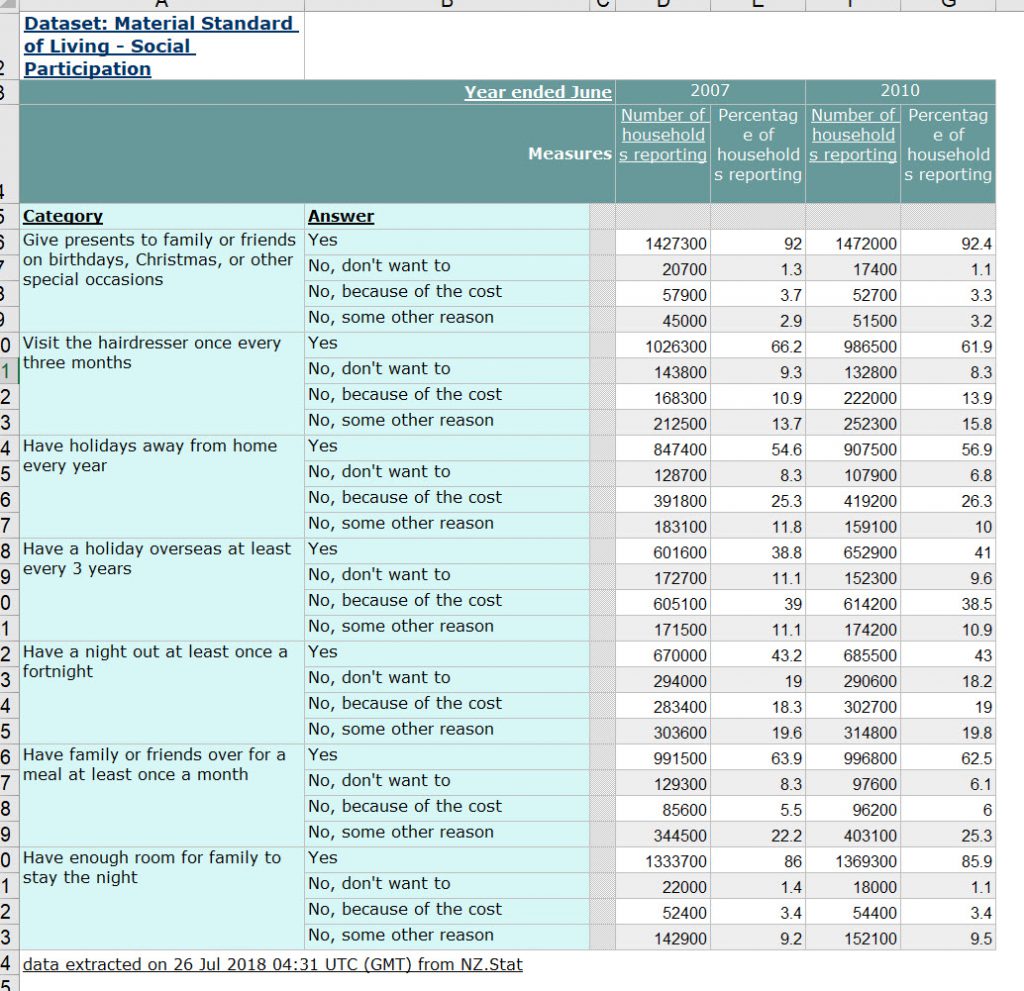
If I use the Export to Excel button (top left of Turquoise table edge) and open in Excel, the table looks like this:
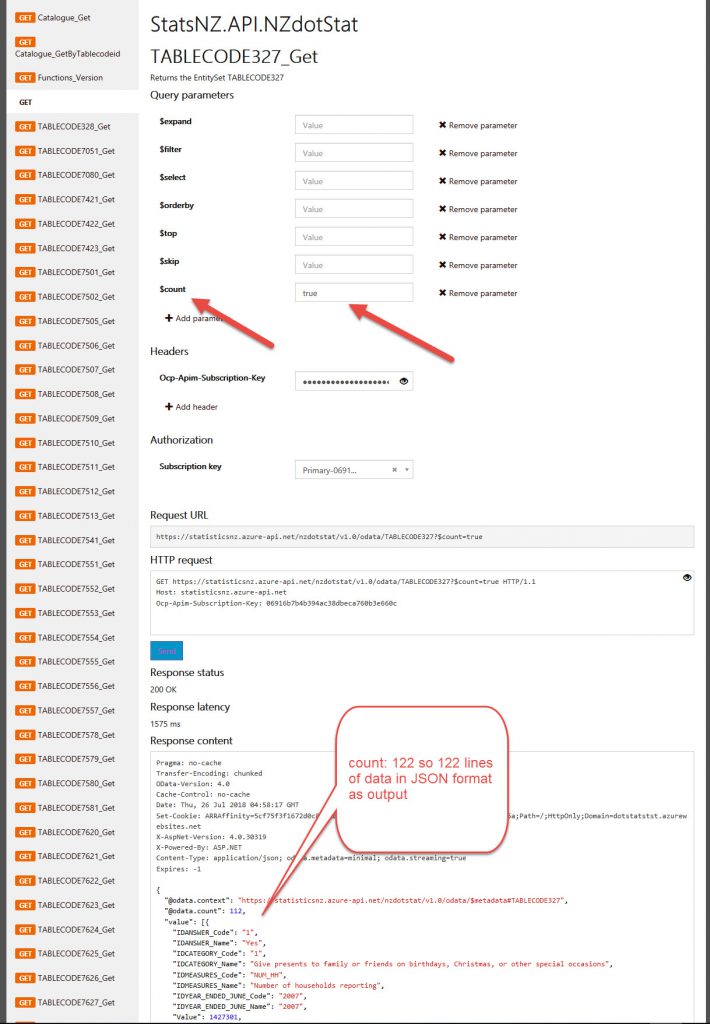
On the API call for the data using $count = True there are 112 lines of data in JSON format.
Copy/Paste JSON data into JSON to CSV converter to get CSV output:
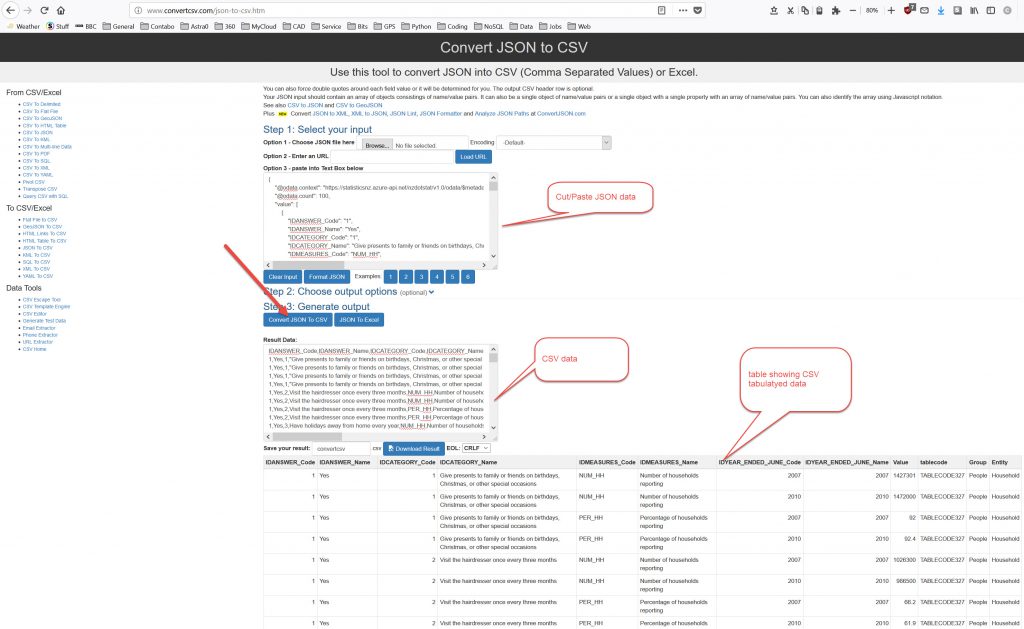
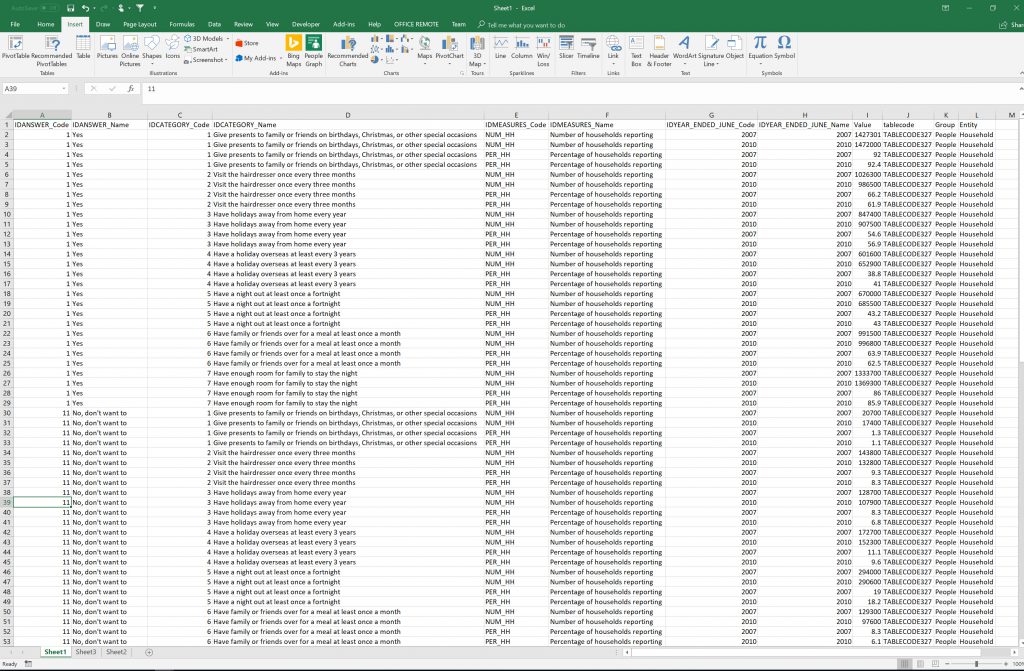
So we get a CSV file like below, that looks nothing like the table that is displayed on the Stats website.
So we’ll use a Pivot Table to re-configure the data to display it in a similar format to the stats site. (I must note that I still haven’t got my head around Pivot Tables, I keep on meaning to write an article on it, but feel I’ve still got a lot of learning before I can do this, I just can’t seem to visualise it, although once displayed it makes sense, its visualizing the result from the raw data, I don’t seem to be able to make thew mental leap!):
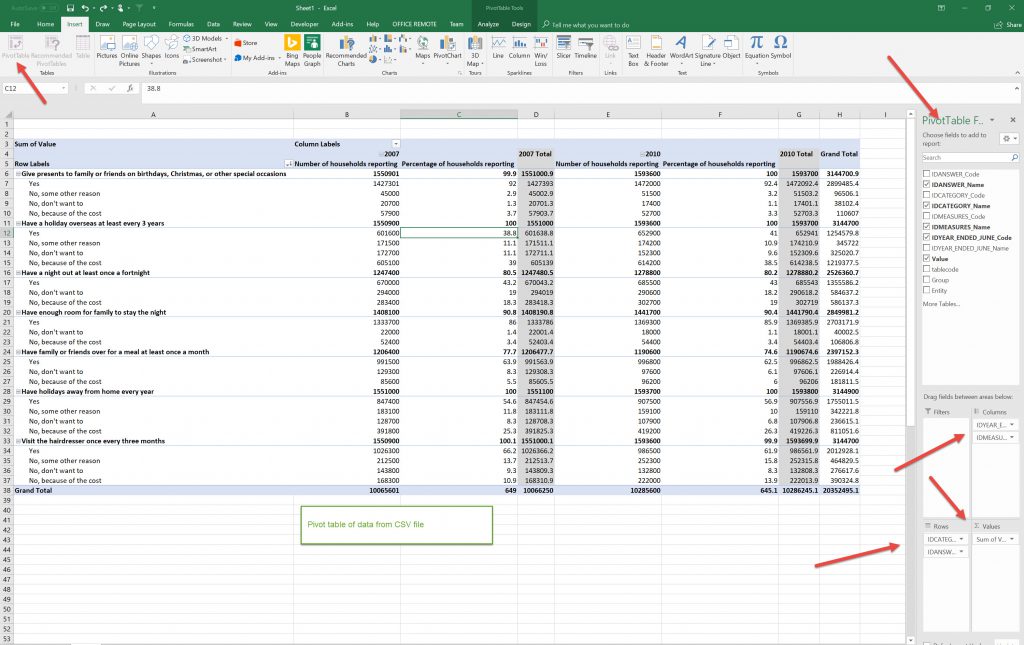
Which now looks similar to the stats data except theirs does not have totals for the categories.
What this tells me is that after getting the data from the API from a site, it then needs some post-processing to be able to get it to the format so that you can convey information to others.
Using the API you can draw down updated raw data, and specifically filtered data that is relevant to your project, in the case above a few of the Code columns could be filtered out as they are not used.
This does mean that you need to use a programme like Python to do the post-processing after you capture the data that you want from the API to push the data into DataFrames to manipulate. I suppose you could use JavaScipt or D3 or something similar if you are displaying information on a web page with updated data. As you know what to expect coming from the API you can build some form of transformer to adapt the data to how you want to display it.
The sendex tutorial on data analysis with python do some exercises using the Quandl API for free datasets to manage and manipulate in python.
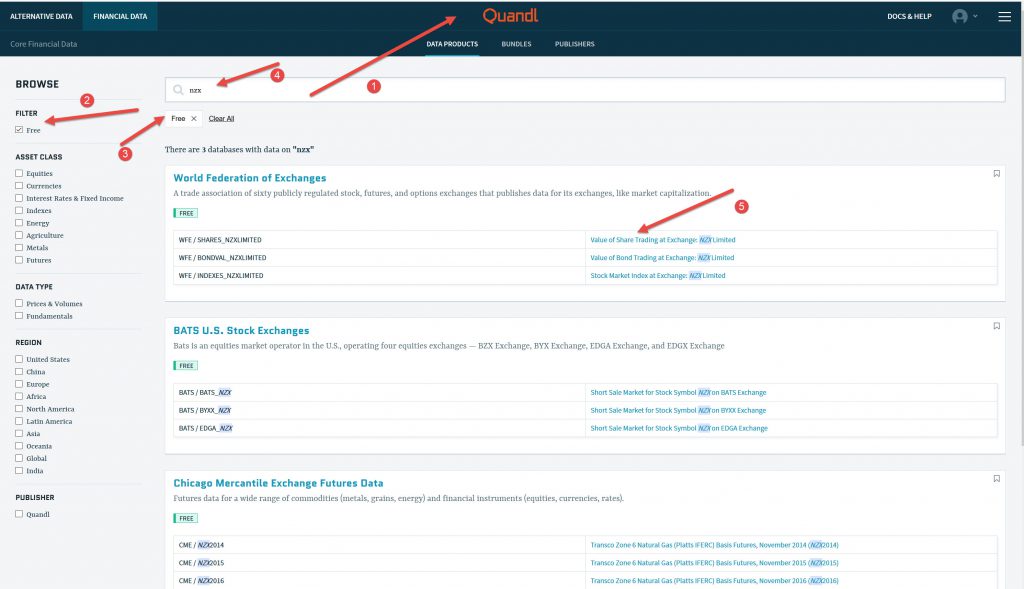
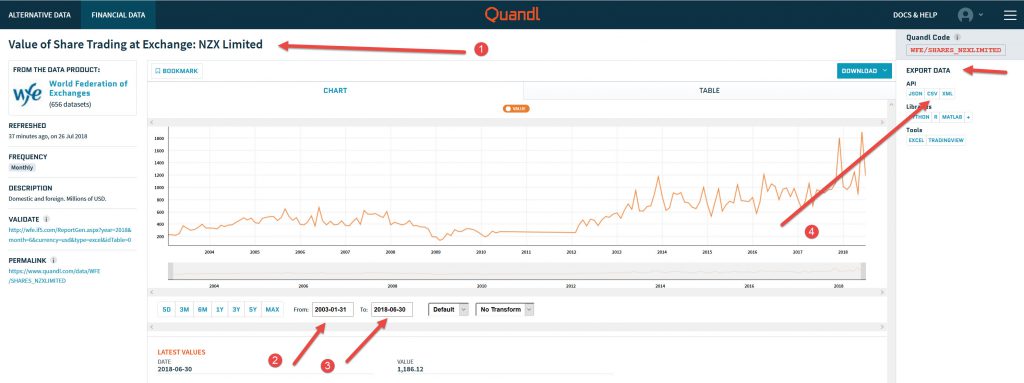
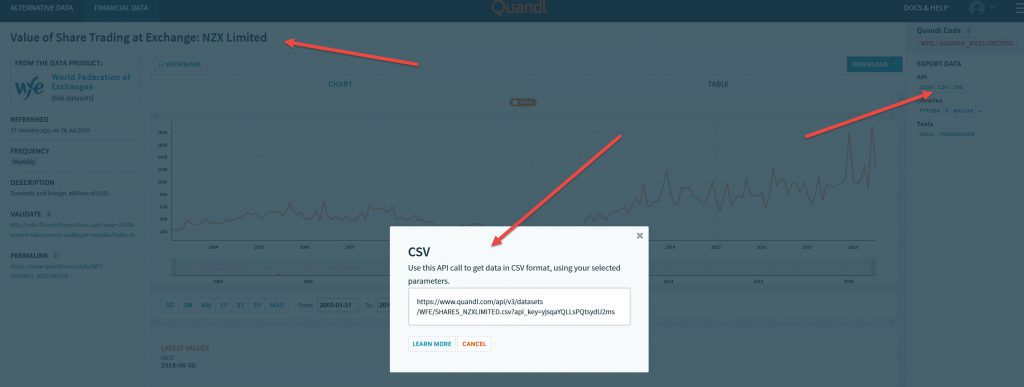
Using the Quandl free “Financial data” links as shown below on selection of free data (I think I used my free account to get the link) you can download a lot of data, in this case it is in CSV format already, which is handy.
End comment
The appeal of getting “current”, “live” data transmitted to your programmes is appealing. There are a lot of organizations out there that are offering information via an API.This gives you a time stream rather than a static snapshot of data (eg a CSV/XLMS data download snapshot at a point in time).
Another aspect of the API process is that you are trying to automate a process. Getting a process up and running is challenging, but once you have de-bugged it , it should tick along nicely until someone re-configures the API.
From my experience so far, it is a great way to gather new data that is regularly updated (not sure if the Stats.NZ site is updating anything- but a good practice area (although hard with no supporting doc’s)) . The article I wrote on Trello to Zapier and weather data API to mobile (I have this working but the output is not elegant) demonstrates tailored Apps for capturing API data. But with those you get what others have built, the same with IFTT. After looking through their libraries there were not too many I actually found useful personally.
Grabbing the data from an API via Python or some other method allows you to get the unrefined data that you can tailor to your specific needs without someone else’s view on your requirements. You then have to massage the data to what you want it to do. The post-capture processing. This is where you define/express what you want the data to convey.
Although there are a lot of API’s out there, some of them have a paywall , so you need to explore alternative sources (NZX paywall, Quandl have some NZX data free).
At some point in time there will be a convergence of playing with API data and Machine Learning on that data. I am not quite ready for that yet but I can see this is one of the outcomes of my investigations into data streams.
In some ways this is IOT (internet of Things) data streams being gathered from an API process to be analysed by a Machine Learning Programme/AI to predict outcomes from raw data. I’m definitely not anywhere in that ballpark, but I see myself stumbling towards it.
Finding leads for my Services Website- web scraping? Part 1

Raspberry Pi 3 Model B setup