Web Data 3- Part 2. Google Sheets API to Web Page automation
I like it when I find some useful code and it works straight away. When it doesn’t I end up spending an awful lot of time trying to figure out what is happening. turning the programmers dark magic into something comprehensible.
Continuing on from the previous post I started to look at the output and code a bit more closely. I think this process is quite useful, so I decided to write about the coding process so that if I revisit this later I wont spend so much time trying to re-figure it out. The main area of focus is on Anthony Brunson’s tutorial number 2 of adding the extra coding to display results to a web page. The google API will just stay as Dark Magic!
Here is link to file I am talking about. Right click on the page and choose “View Page Source” and cut/paste into text editor to explore.
Json output
Initially I thought, I have JSON output, great. But didn’t look at it too closely. In fact, because of the spreadsheet layout the information in json is in an array, or rather an array in an array.
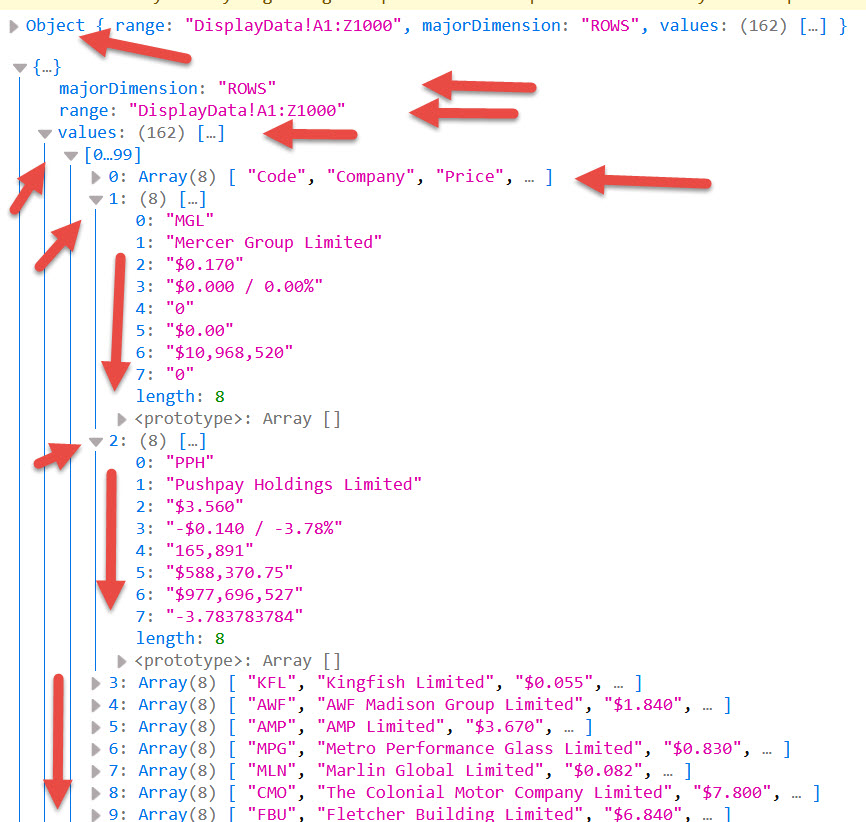
If you look at the console output at the top level, it is called object:
majorDimension: “ROWS”
range: “DisplayData!A1:Z1000”
values: Array(162)[ (10)[…], (10)[…], (10)[…], …
If we drill down further, looking at item 0: of the values: we see that it has values of 0: to 9: (so 10 values). At the end there is an item length:10 that tells you how many items there are in array values: 0:
First. Values: 0: is the header column of the spreadsheet, so contains all the column headers (Row 1 in spreadsheet). Secondly, the following values: 1:, 2:, …..161 will all be the data rows.
function makeApiCall() {
var params = {
spreadsheetId: ‘….’, // TODO: Update placeholder value.
range: ‘…’, // TODO: Update placeholder value. };
var request = gapi.client.sheets.spreadsheets.values.get(params);
request.then(function(response) {
console.log(response.result); // TODO: Change code to process the `response` object:
The above console.log call takes the response.result object and displays it in the console. This is the JSON file output.
So in the Json output at the top of the page the Object = response.result
In javaScript you can use the .length to find a length of an array,. so to find this in the json file we have and write it to the screen we can use:
document.write(response.result.values.length ); [Give me the length of the array of Object: values: ]. This will tell us the number of rows (including header) in the spreadsheet
We can also use:
document.write(response.result.values[0].length ); [Give me the length of the array of Object: values: 0: ]. This will tell us the number of columns in the spreadsheet.
So if we wanted to grab the value of the 2nd item of the 4th array (remember arrays start at 0, not 1) in the json file:
then in javascript we would write:
document.write(response.result.values[3][1])
This would give us the 2nd value of the array within the 4th array of values. Which would be “ASB Capital Limited (NS)”.
Looping
In the tutorial, instead of using console.log(response.result); a new function populateSheet(response.result); is added. If we look at the function that is added:
function populateSheet(result) {
for(var row=0; row<8; row++) {
for(var col=0; col<3; col++) {
document.getElementById(row+”:”+col).value = result.values[row][col];}}}
The code takes the result object and loops (iterates through, starting from 0 to 2 (col<3), so in english columns 1,2,3) through the columns (inner for loop- 3rd line of code) then rows (outer for loop-2nd line of code) and pushes these results out as a table.
row 0: col 0, row 0: col1, row 0:col2
row 1: col 0, row 1: col1, row 1:col2
row 2: col 0, row 2: col1, row 2:col2 etc
which would give example results from a table with 3 columns and 3 rows :
| Id | Name | Where |
| 1 | Cat | Wellington |
| 2 | Dog | Auckland |
So the function gets given a json file and it loops through it.
How big is the JSON file? If you tried using this code on the json output we have which has 10 columns and 162 rows it would get confused and break as it would read the first 3 columns from row 0 correctly and then would try and read the first column of row 1, but the next item in the json array would be column 3 row 0, so it would stop and break.
So we need a way of making sure we have the correct length of the arrays (cols and rows) to feed into the loops of the function, then it won’t break, whatever shape json file array we give it, so we change the code in the function to this:
function populateSheet(result) {
for(var row=0; row<result.values.length; row++) {
for(var col=0; col<result.values[0].length; col++) {
document.getElementById(row+”:”+col).value = result.values[row][col];}}}
PHP Grid code
The other additional code in the tutorial has some PHP code:
<div style=”margin-left:auto; margin-right:auto; width:1960px;”>
<?php
for($row = 0; $row < 8; $row++) {
echo “<div style=’clear:both’>”;
for($col = 0; $col < 3; $col++) {
echo “<input type=’text’ style=’float:left;’ name = ‘$row:$col’ id=’$row:$col’>”;}
echo “</div>”;} ?>
Results
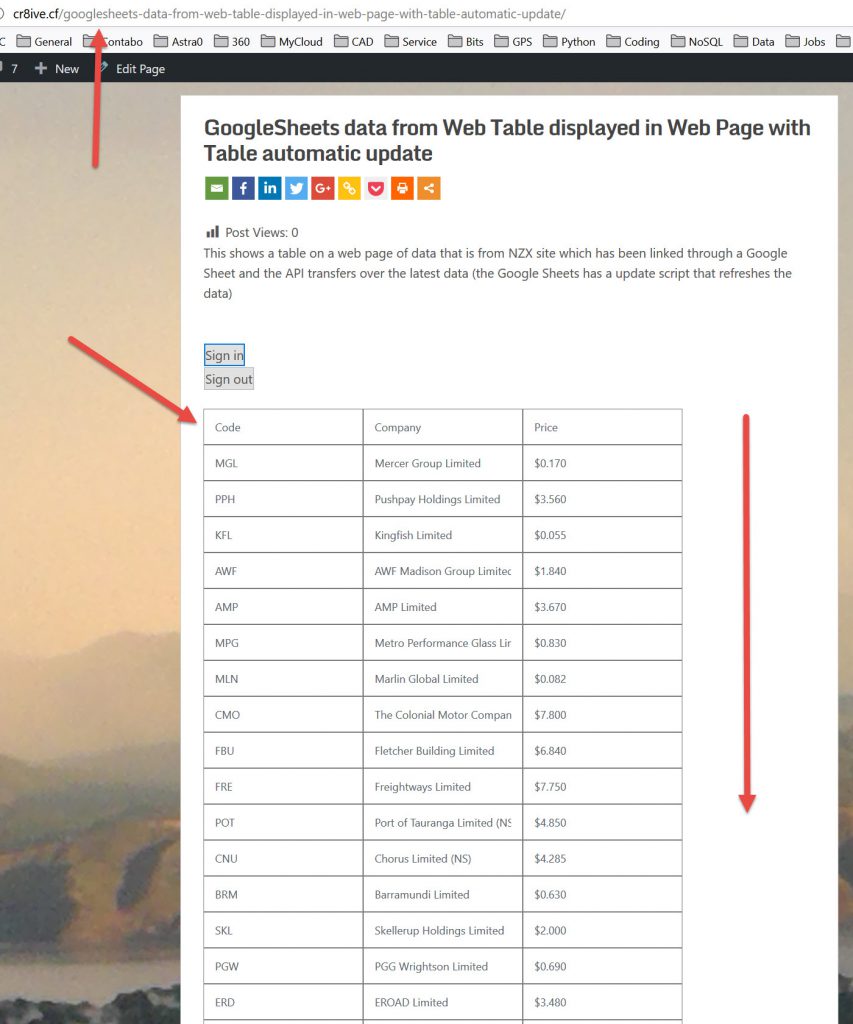
If you look on this page : GoogleSheets data from Web Table displayed in Web Page with Table automatic update you will see table frame.
I am having a few issues with the data being displayed. Its the sign in issue.
So I am still having issues with accessing the data from the spreadsheet even though I have made the spreadsheet public and accessible to the web. I still have to work through those issues. I have found this site about Auth2 Google playground that I will explore to see if it can help me.
I put the buttons (Sign In/Sign Out) back in and tried to test from my mobile phone but the buttons aren’t working on that. All a bit of a challenge.
From the last post Web Data3- Part 1. Google Sheets API to Web Page I wanted to do 3 things, I have got the code working, but I still have an issue of login.
I will stop here at this point, still having the login issue. I want to go on and look at updating Google Sheets from the web.
PHP code in WordPress on post/page
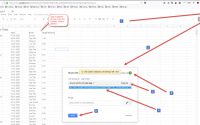
I wanted to make a page to demonstrate the process (see image and link above that is partially working).
WordPress does not seem to allow you to put raw php code on a post or page. Another challenge to the process.
I did find an article How to run PHP code directly from WordPress posts and pages on this. The actual plugin they suggested I couldn’t find but I used PHP code snippets (Insert PHP) where you add a shortcode to your page and that works fine.
End Comment
Yes, data is displayed on the web page from Google Sheets. Unfortunately with this tutorial it is static, and has a fixed order. There is no highlighting of Column headers nor is there any formatting.
The share market data that I am displaying needs to be sorted to be able to be explored.
The solution is to look at JQuery dataTables which will allow for some formatting and sorting. That is another exercise. The failure issues I highlighted in Part 1 of this process showed dataTables displaying information from Google Sheets, so it is possible. I hope to show on the page where I am displaying current output GoogleSheets data from Web Table displayed in Web Page with Table automatic update the two types of outputs, but that is for another day. DataTable example here.
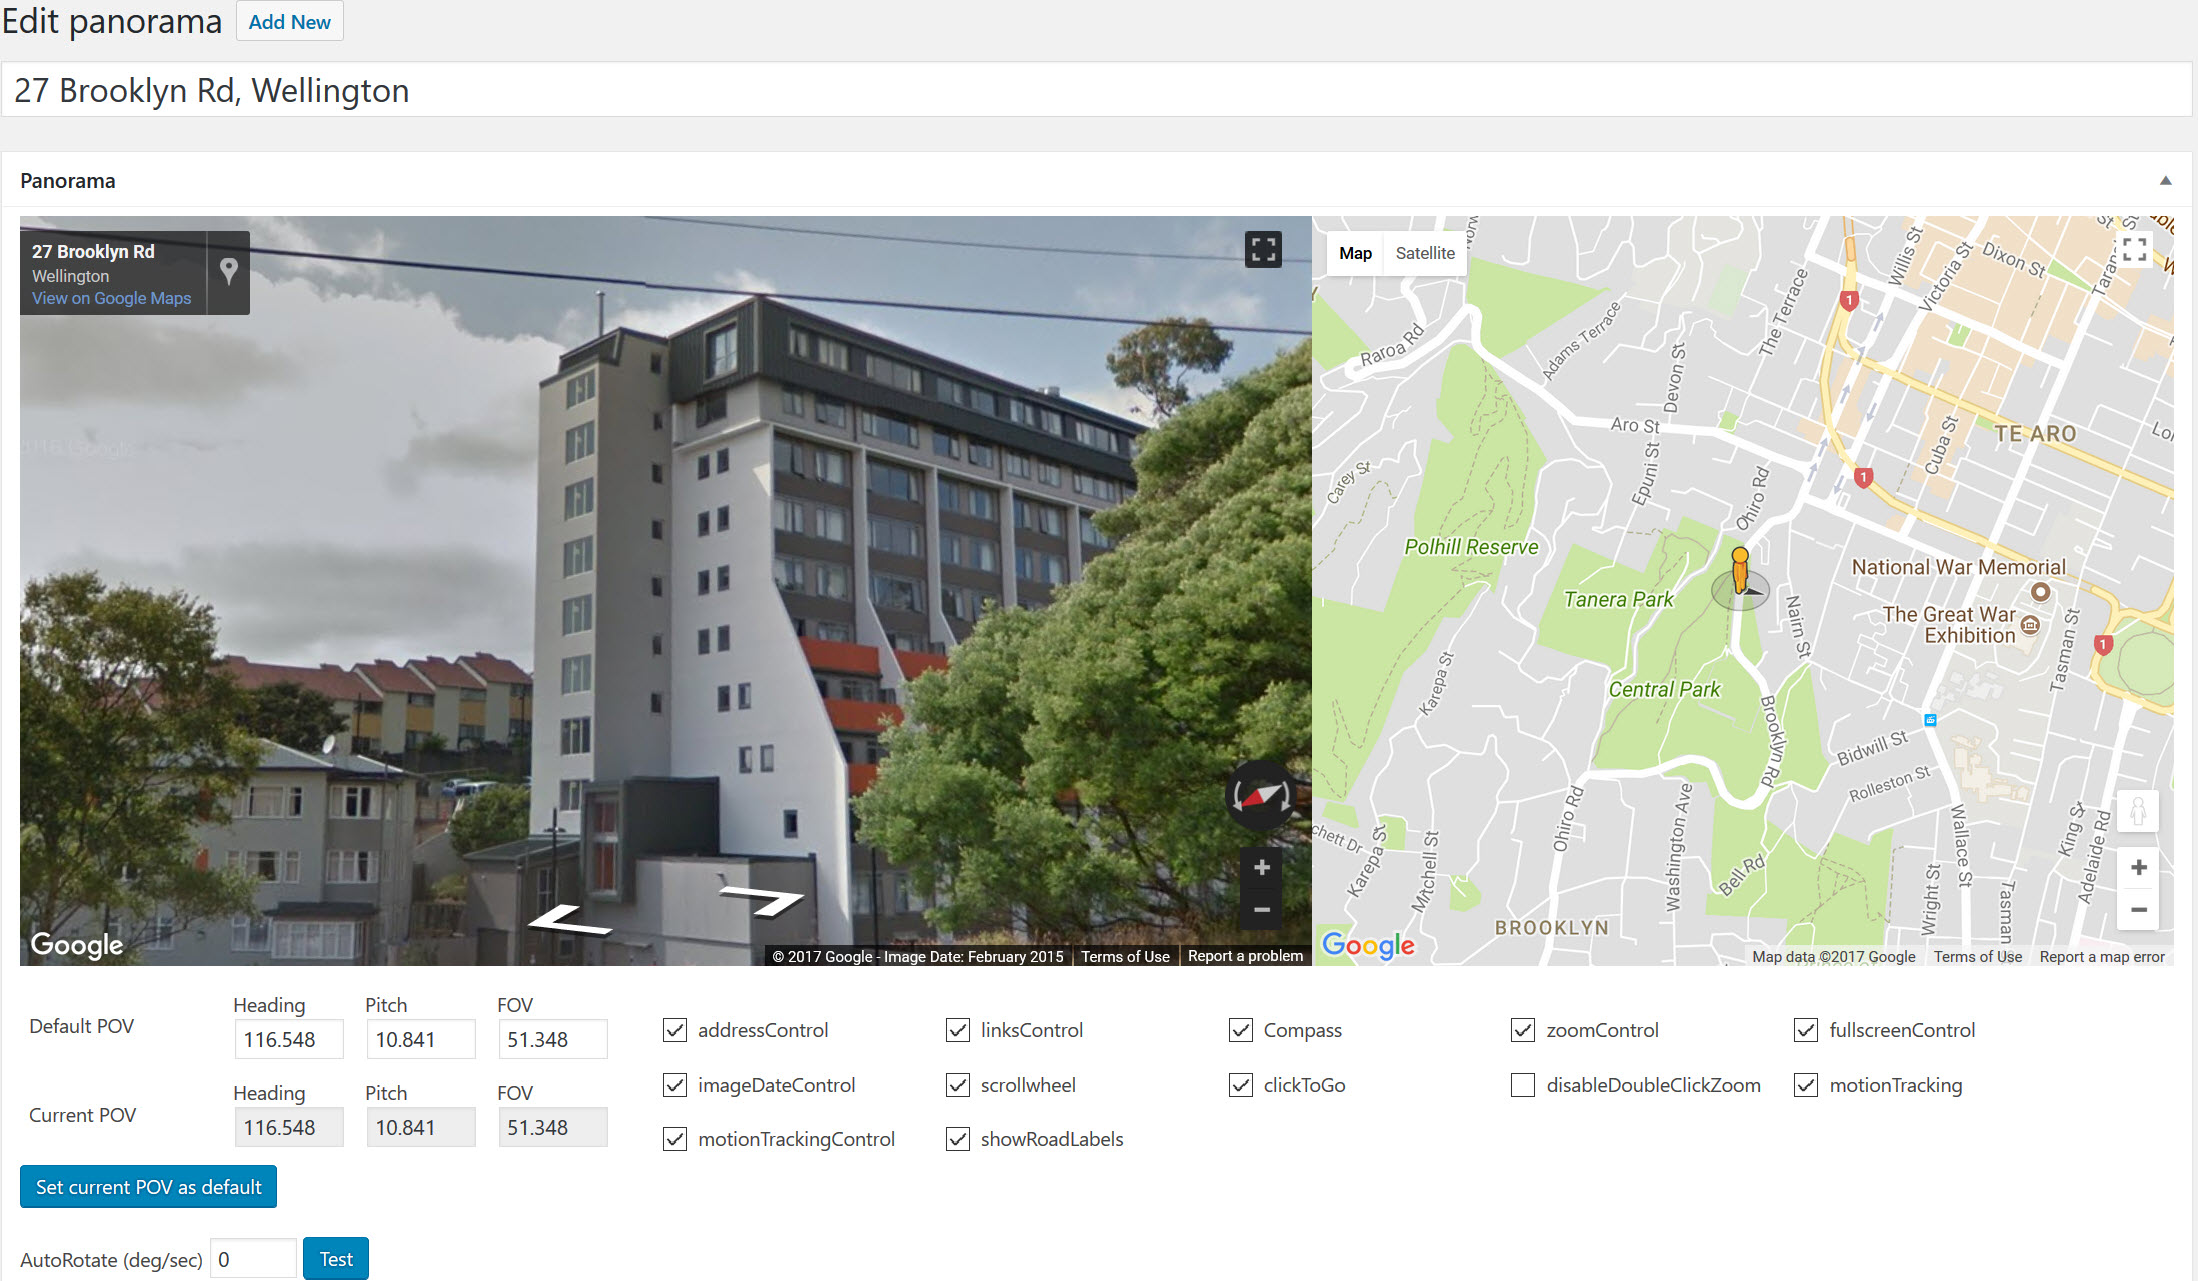
I have been talking to a friend about doing 360 panorama images with hotspots and publishing them. I have done this using Python, see Panorama file Hotspot setup using FREE Photo Sphere Viewer, plan link & tabs and Python 6. How to automate the creation of HTML pages for 360 Panorama’s .
We have been discussing if there was a simple process to get users to be able to put these into the photos themselves. The friend suggested a web page solution, I proposed a Spreadsheet solution:
The outline of the process would look like:
Excel Macro templates (similar to my 3DPDF to tables Macro). As most people will be comfortable with Excel.
- Will need a setup directory for the photos and a sub-directory with all the panorama viewer code.
- Will need to have a CSV/Excel file with names/directory of photos. (Note, these most probably need to be renamed- this can be done with Excel & windows CMD ( a process can be done: https://benholland.me/tutorials/2011/11/11/rename-multiple-files-using-excel-in-windows.html)
- Will have to load the file to view of the image that they want to put the link into ( eg view in Paint to get x/y coordinates of where the hotspot to go)
- Then the Target location & the Hyperlink (to the proposed photo- I think realistically, it has to be part of the set in the specific directory) will needed to be added ( Can have columns for this in Excel Macro)
- There may be multiple links from one photo (eg A hall to lots of units), so have to make provision for multiple links)
- Then automate process of creating HTML file for the photo’s. ( Can be done in Excel – http://www.meadinkent.co.uk/xladvhtml.htm)
- These need to be processed so that they all end up in the same directory so you can Zip them up and share the whole package.
Maybe the Google Sheets to Web, if bi-directional, can be a web & spreadsheet solution. So I want to explore the updating Google Sheets from the web as per Anthony Brunson’s tutorial number 3. This is the next exercise I want to stuff up.
So what is still outstanding is Login Issues for accessing Data on the web, even with public sheets & setting up JQuery dataTables.
WordPress Free Panorama Plugin Testing
Web Data 1. Capturing Web data via Google sheets and Displaying on Web Page