Web 2. Google Sheets to Web – ICF Canoe Polo 2018 World Championships Welland Canada
My son in law, Karl Reece is playing in the Canoe Polo 2018 World Championships Welland Canada for team USA. I am very impressed with his accomplishments. Come on USA & NZ.
Games played, won/lost based on Groups in table below at the end of 4/8/2018 at Canoe Polo 2018 World Championships Welland Canada.
I read on my daughters Facebook page (I try not to use it, but occasionally check it for an update on my children overseas) that the event was on so I thought I’d use the competitions information as a test for capturing data from the web, transforming the data and displaying some information on my web page, with automatic updates as the results came through.
Note: Data below is erroneous. I presumed that left column was the win side and right the lost side but in fact it wasn’t the case. I needed to put an extra IF conditional clause to adjust the tables so that the data did work this way.
In fact, for the men’s competition Germany won, Italy came 2nd, Spain 3rd, France 4th and NZ came 5th. Well done NZ. USA did not have a good run this time around. Better luck next time.
https://docs.google.com/spreadsheets/d/156xlI9H8mME3TkJGmme338MonVIWLtvZo4GfryJ1d2s/edit#gid=668009868&range=A1:E29/view
This link was got from selecting the area that you want to view and Right mouse click and click on option “Get link to this range”. Because I created this I still see all the tabs and other stuff associated with google sheets but apparently others do not. It is a bit raw so no formatting of the table as far as I can see.
Process, started with Excel, then went to Google Sheets
This was supposed to be a demonstration of using Excel and get from web:

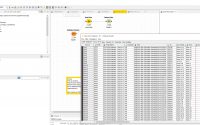
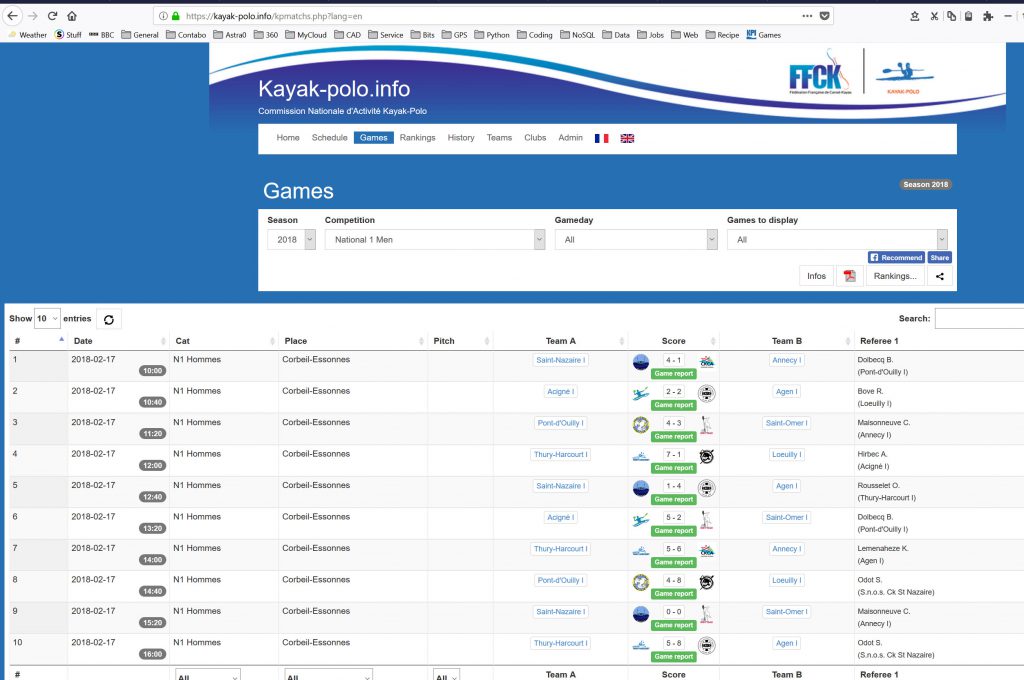
The table is showing , but it has a default of only showing 10 entries. You can pick more, but have to select another number from a pulldown list. This is a JQuery dataTable. See DataTables for dynamic database queries for tables on web pages & export tools.
Every time I tried using Excel pull the table in it would only show 10 lines of the table, there was nothing I could do with the settings to get any more entries from the URL call.
I then tested on Postman until I got the correct information on the table that I wanted ( There were 4 events, I wanted to filter for senior mens only). On the postman test with the URL below all the entries are shown. If you do it in a browser, it initially shows them all then the DataTables default kicks in and only shows 10 entries.
https://www.kayak-polo.info/kpmatchs.php?lang=en&Saison=2018&Group=CM&Compet=CMH&Round=*&Css=welland2018&navGroup=1
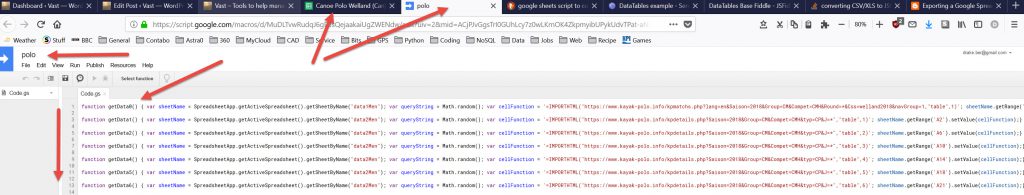
So, after trying with Excel (I was planning on putting the Excel workbook onto OneDrive and then embedding a link to the web page) but I couldn’t do anything with only 10 entries. So I went back to Google Sheets and using:
=IMPORTHTML(“https://www.kayak-polo.info/kpmatchs.php?lang=en&Saison=2018&Group=CM&Compet=CMH&Round=*&Css=welland2018&navGroup=1”,“table”,1)
I got the whole table displayed and was able to do some data manipulation and graphs on some of the data inside Google Sheets to display on the web (not very relevant ones as the teams had progressed through to the semi’s).
Updating Data
I also used the process described in the previous post for updating the tables so that the data was the latest for displaying.
Transforming data
Trimming data:
Some of the data was not tidy, there were results and text in the same cell, eg :
2 – 11 Game report
So I had to split it using a new column with say =Left (L3, 3), or =Mid(L3, 3,2) or =Right(L3,3) to break the data up. On these trims I usually had to change the data type of the column from Text to number, sometimes it worked using format, another method I found was to multiply the result by 1 (eg Left (L3, 3)*1) and that changed the cell to a numeric value.
Conditional Function:
Also , as the event was in progress, so some of the results displayed as:
Awaiting
So I had to use a conditional function
=IF(logical_expression, value_if_true, value_if_false)
And I used it :
=IF(G86=“Awaiting”, “Awaiting”,(mid(G86,5,2)*1))
Countif() Function:
The table had the winning team on one column, then the score, then the losing team in the next column to the right. So if a team was in the left column, it had won the game, if it was in the right column, it had lost the game. To count how many times a team had won I needed to count the number of times that team appeared in the left column, and fir loses in the right hand column:
=COUNTIF(data1Men!$L$2:$L$89, A6)
Use a New Table for display, not original imported table
I would strongly recommend you do not try and display the original data/table that you have linked to for a couple of reasons:
1. Formatting. As the data is refreshed at intervals, it basically refreshes all the cells where the table is shown, so formatting is blown away.
2. Data Structure & Type. A lot of times the imported data needs transforming, say there is text & numbers and you have to filter out the text and be left with the numbers. Then you need to make the column with the numbers into a DataType number, not text. So if you did this on the original table, the Column would be refreshed from the original source and it would go back to its original DataType (text) & any formula you had in the cell would be deleted.
So, link to the old data, even link to a different sheet. Have an import sheet & a display sheet where you display your information.
I think I mentioned before (previous post) that the Google Sheets link shows the first tab, so better to import your data into “Sheet2” and have “Sheet1” for displaying final information.
I really do not like the iFrame display of Google sheets (Nor Excel) on a web page but you could make a pretty cool dashboard from the Graphs. In fact, when I was getting the code I found that for graphs you can LINK or EMBED and I used the EMBED process on this post, far neater than the iFrame for the Graph on the Web Data 1. Capturing Web data via Google sheets and Displaying on Web Page
post.
Power BI test
As Excel was pretty limited, I wonder if Power BI would have fared any better? So I tested it:
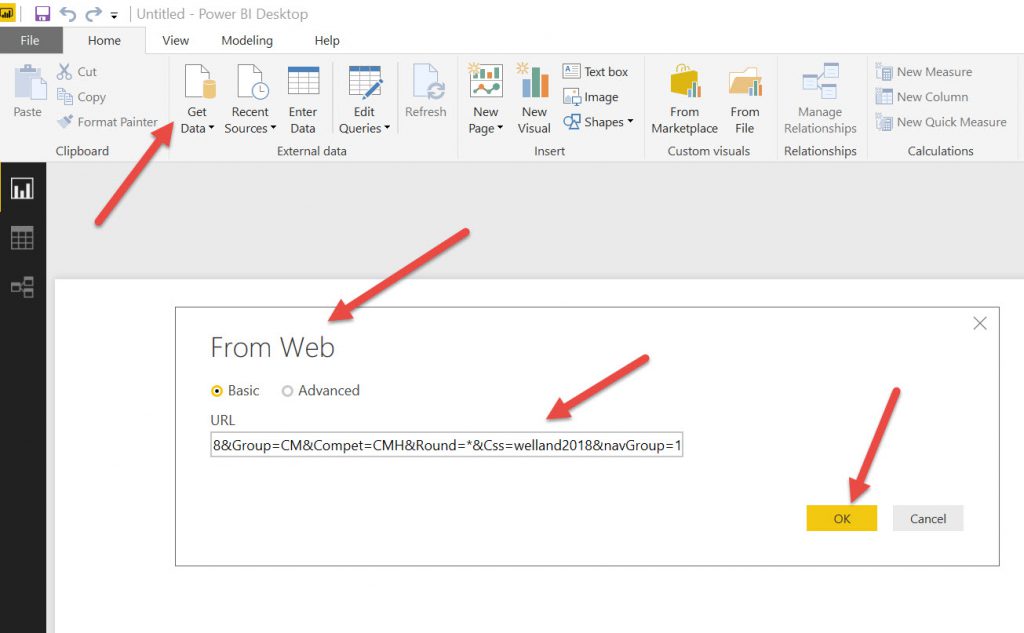
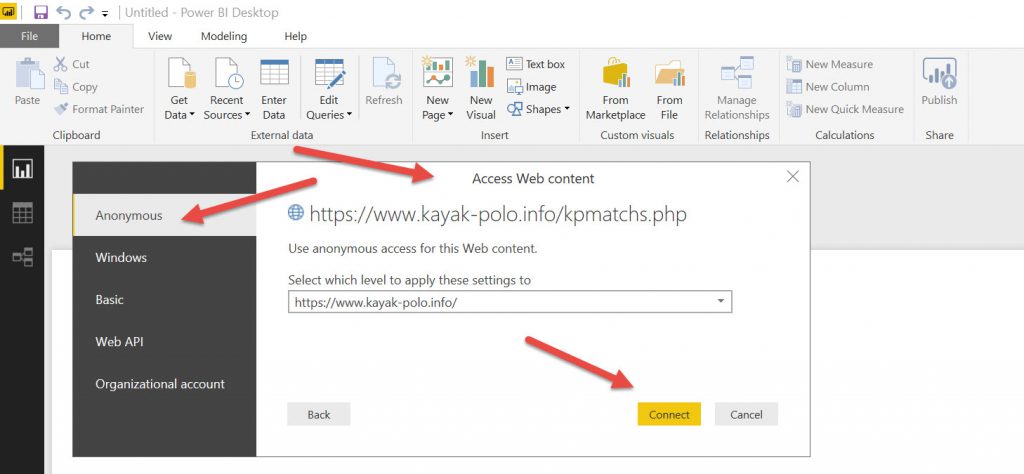
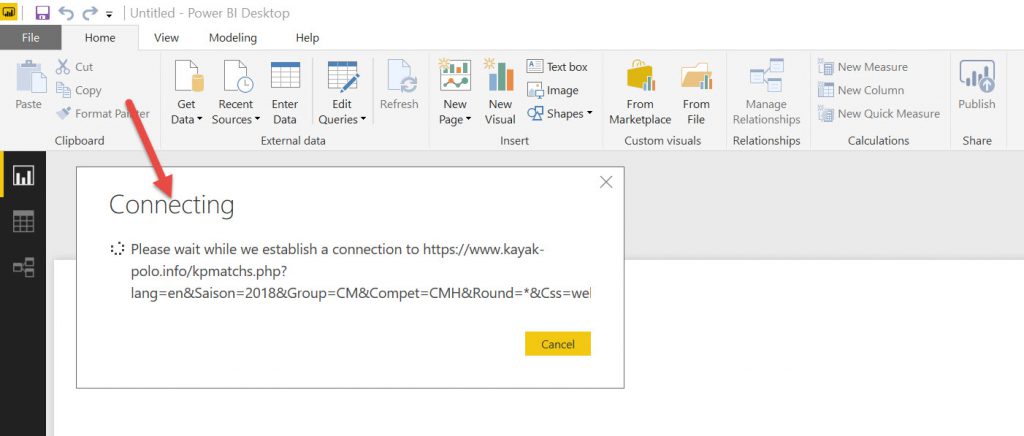
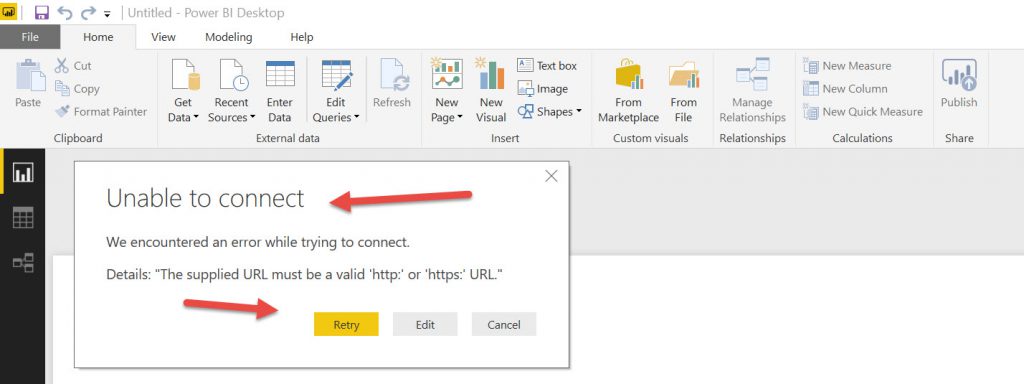
I tried editing the URL and simplifying it but Power BI did not want to talk to it at all. So that was not successful either.
I tested the URL again in the browser, the exact same as used in PowerBI and it works fine:
End Note
The initial plan of using Excel didn’t work and I had to go back to Google Sheets. So this post did not end up where it was supposed to be by demonstrating Excel’s web scraping ability.
I spent a lot of time trying to get Excel to work and wasted a lot of time on that and figuring out about the dataTable issue. Once I moved to Google Sheets the setup did not take too long.
It was quite easy to transform the data in the spreadsheet and then display a different table, with links to the original tables to display the data that I wanted to show. In fact, I had to link to 6 group tables separately so that I could get all the teams and then be able to filter them into the groupings of biggest winners and biggest losers.
Power BI ended up being pretty disappointing, not even being able to connect to the site.
This post started out looking at tide data (following on from previous post) and I think I may look to embed some graphs/charts into a page for a neat solution rather than a spreadsheet.
Actually, if you could grab the data in Google Sheets and then write a script to push it to a Database, then you could use a JQuery DataTable to display the information on your web page. A bit of a convoluted process, but this is because you do not have access to the raw information in the original database.
In fact, looking on the interwongle, just use Google sheets as the database and use a JQuery DataTable on the web page to format the table data you want displayed. There is this discussion about it. Also a link to a JSFiddle example. All for getting a more tidy output than an iFrame. The issue seems to be changing the Google Sheets export to a JSON format. There is a post here on sheets to JSON (images wont show) with a link to a Github JS code for the process.
Although I am less familiar with google sheets and am not overwhelmed with using an online spreadsheet I think it does a fine job. I must admit a bias for Excel, but in this case I’m disappointed, there are some things it doesn’t do well.
Tournament is on its last day on sunday 5/8/2018. Here are where the teams are sitting at the moment:
https://www.kayak-polo.info/kpclassement.php?Saison=2018&Group=CM&Compet=CMH
| Day | Data 1 | Data 2 | Num |
| 24/7/2018 | John | Brown | 25 |
| 25/7/2018 | John | Brown | 25 |
| 26/7/2018 | John | Brown | 25 |
| 27/7/2018 | John | Brown | 25 |

Free BricsCAD Shape concept modelling tool & Free 2D Draftsight Cad Drawing Software both with .DWG file extension
Regular Expressions/Regex for data cleaning