Visual Asset Strategic Tools. Capture Building Information for Building Life Management. Open Source/Low Cost Technology Solutions for you to control your buildings
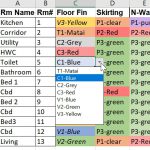
The first process I did Architectural Colour Schedule in Excel used VLookup() to lookup a table on a separate sheet, but it did not show you the choice of selections. This time I want to be able, when looking up a room finish, to see what the selections are, so that I can choose an
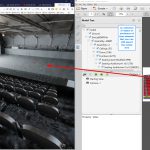
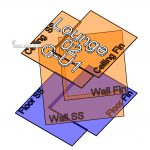
Following on from Multipurpose function hall and variable seating prices, I received a reply from Simlab Soft regarding having a clickable link in a 3DPDF. They said try using their Simlab Composer single license: Pro edition costs $199 VR edition costs $399 Pricing page here I had, a while back , had an issue with
Going to get a seat to an Opera or Ballet performance in Wellington I usually trundle down to the ticketek office to book and get the tickets. When looking for seating they usually have a plastic folder with photocopies in and point to seats in the price range you are looking at (usually the cheap
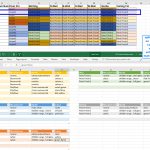
The last post I tried to use AirTable to create a Colour Schedule from a Revit export. Thinking I could use the Database to cross reference items in the room such as doors/windows etc to be able to pull those in to make the colour scheme planning more comprehensive. It didn’t work. Along the way
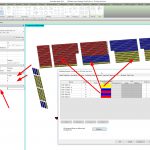
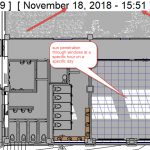
Background I have written a post on showing internal building fabric condition over time in this article Revit Internal Condition over Time.I was not, at the time, happy with the presentation of the information as it was a series of screenshots that I then put in as slides to step through the process. Two things
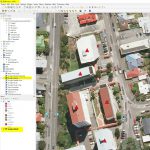
I thought I’d have a look at QGis again now that it has been updated. I’m always wow’d by what people can do with the GIS mapping. Unfortunately for me I’m an amateur playing in this area. I did a cartography course at Uni way back and enjoy exploring some mapping tools. As QGis and
All Posts by Category. Most Popular Posts 3D PDF data access API Automation AWS Free Tier BIM, Revit Data Analysis Data Extraction Databases Drawings Excel, Power BI & Google Sheets Google Docs Graphs JavaScript, ReactJS Knime, Orange, RapidMiner, Weka Maps NoSQL Databases OpenMAINT & Asset Tiger Panorama 360 images Productivity Python Surveying building condition Video
Something I used in one of my earlier exercises was layers on maps, on this post How to use Maps to find Data on Assets. It allows for using an online map such as Google Maps and putting information on that map with specific overlays. Follow the link for example (Note, if you click on
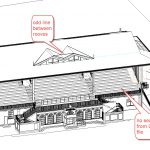
I can’t actually recollect who had told me that you could go backwards in Revit versions by exporting to IFC and then opening a new project and bringing in the IFC into a previous version. I know Matt Cantwell was doing quite a lot of work with bringing information in from IFC’s but not the
A couple of interesting presentations I came across. Solar/Shadow studies by the Revit Kid: Revit Tutorial – True Solar/Shadow Studies A couple of interesting things he did in this video that I didn’t know about: 1/ Using Camera to make a plan orthogonal view (instead of perspective, thus being able to show windows full height