Visual Asset Strategic Tools. Capture Building Information for Building Life Management. Open Source/Low Cost Technology Solutions for you to control your buildings
There’s a Plugin for that! My blog and some of my other web sites focus on visualising Asset & Facilities Management issues , so uses BIM, CAD, PDF’s, maps, databases, photographs, tables, graphs and other data associated with properties. I want to highlight Free WordPress Plugins that have worked for me on my Blog, Demo
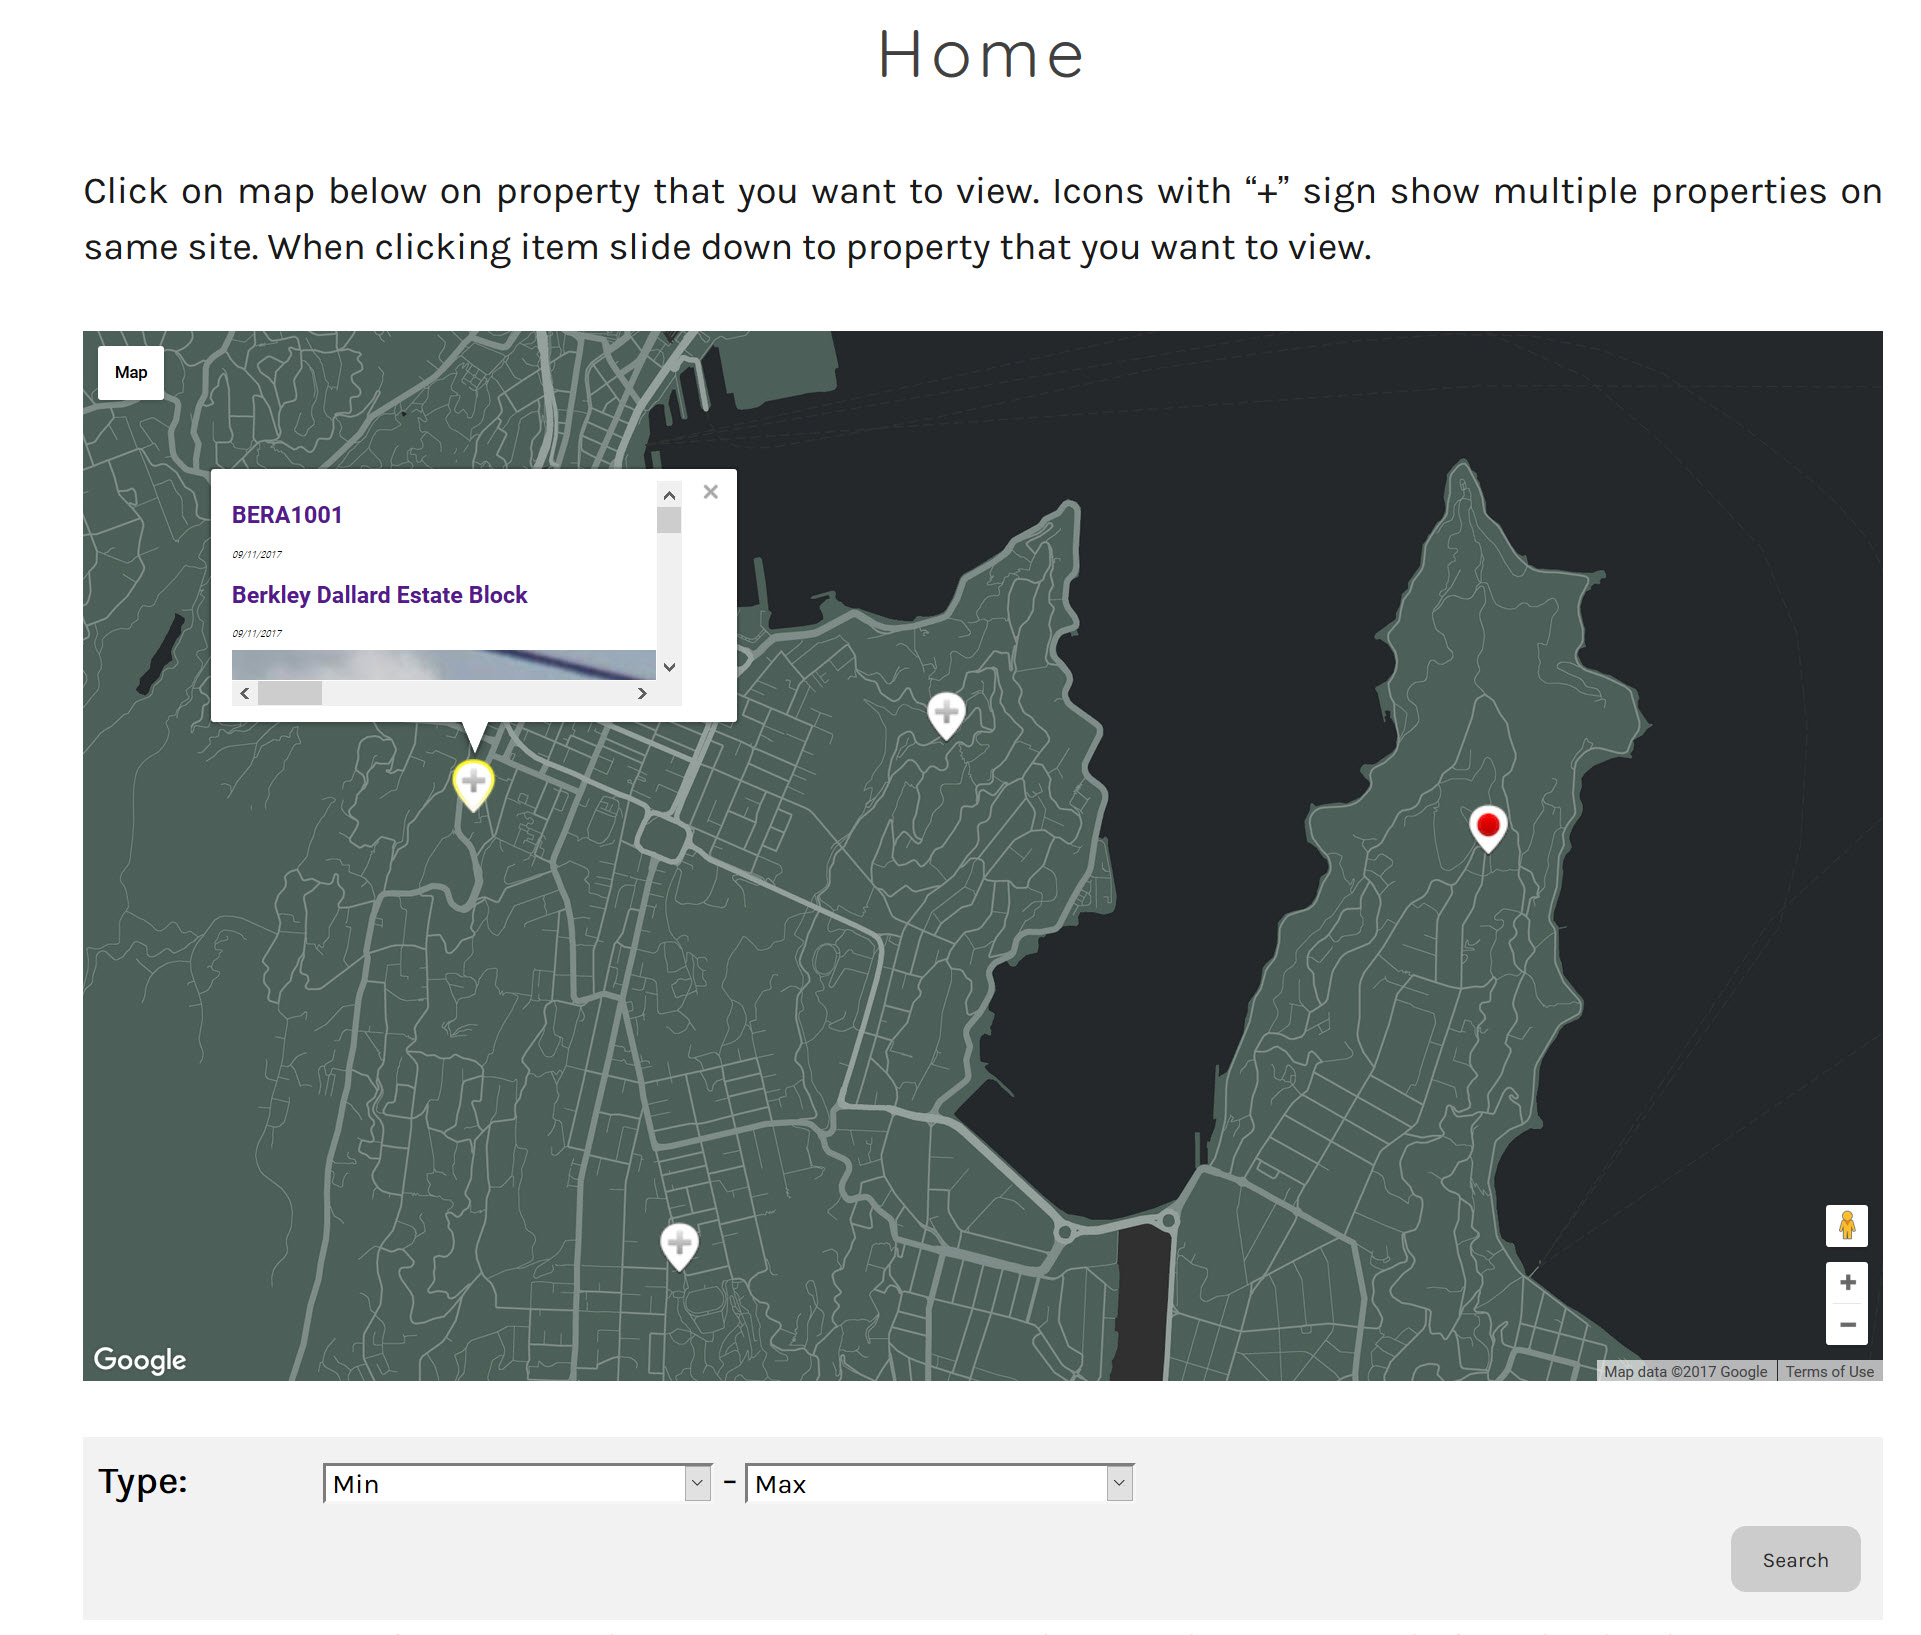
The idea was to alter an existing Real Estate Site to a Asset Property Management Site in WordPress using free Templates/plugins. Go to apriori.ml to view the demonstration site. This has now evolved a bit as I can see extra things that I think I want to do and add to the site. From the
The demonstration site, which uses examples of different free plugins to demonstrate different features, can be found at apriori.ml. Looking at the WordPress themes (free ones of course) I saw there were quite a lot of real Estate Themes and Plugins and I wondered if you could adapt one of these to be a property
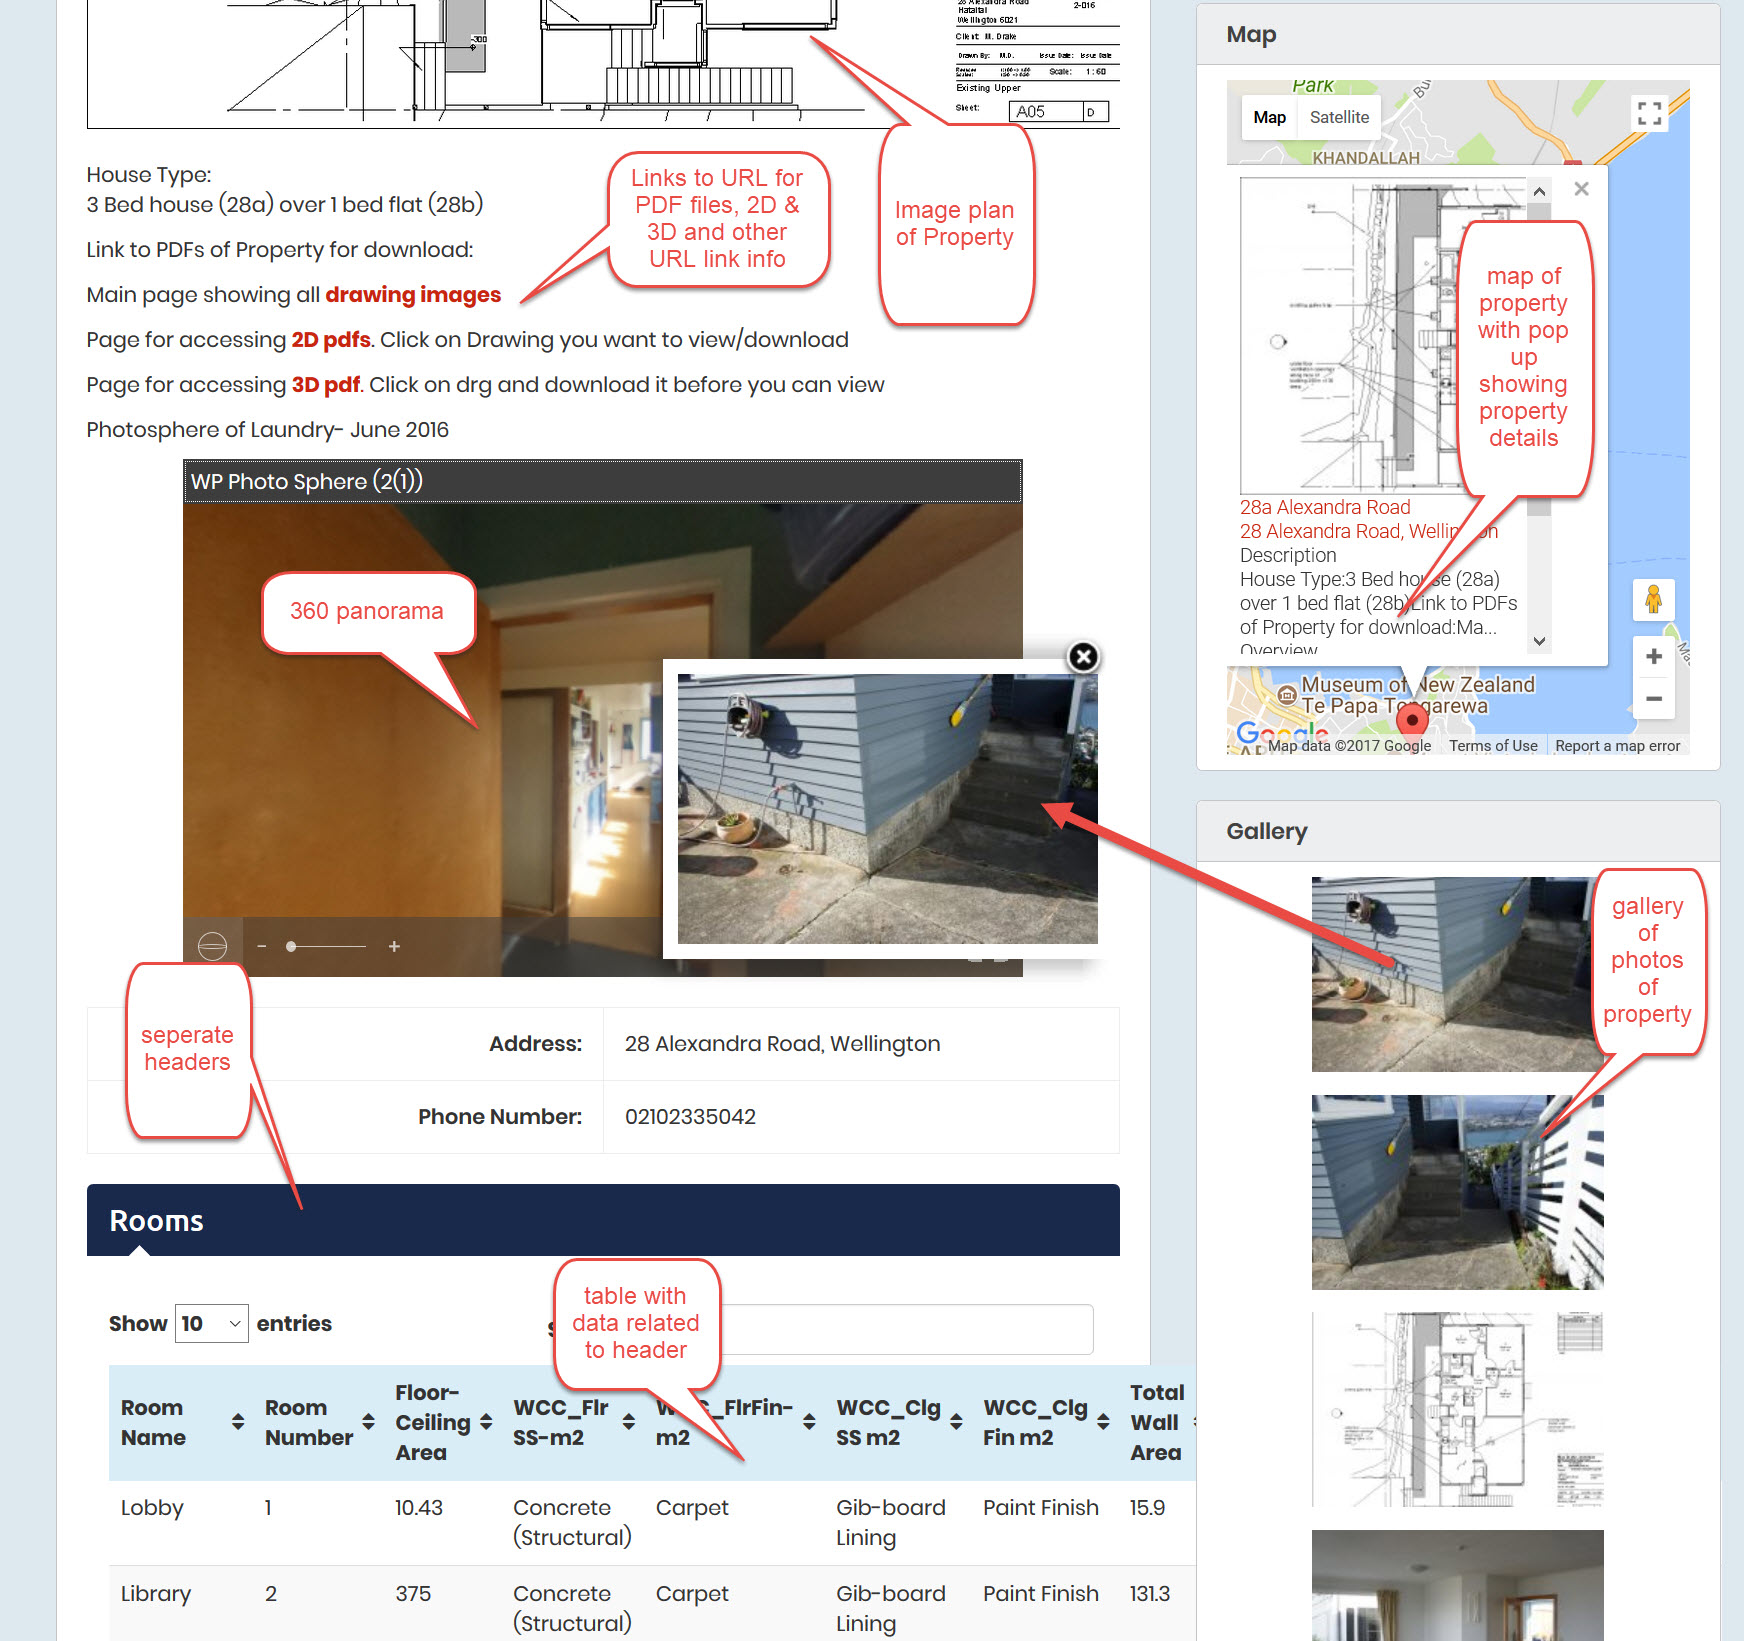
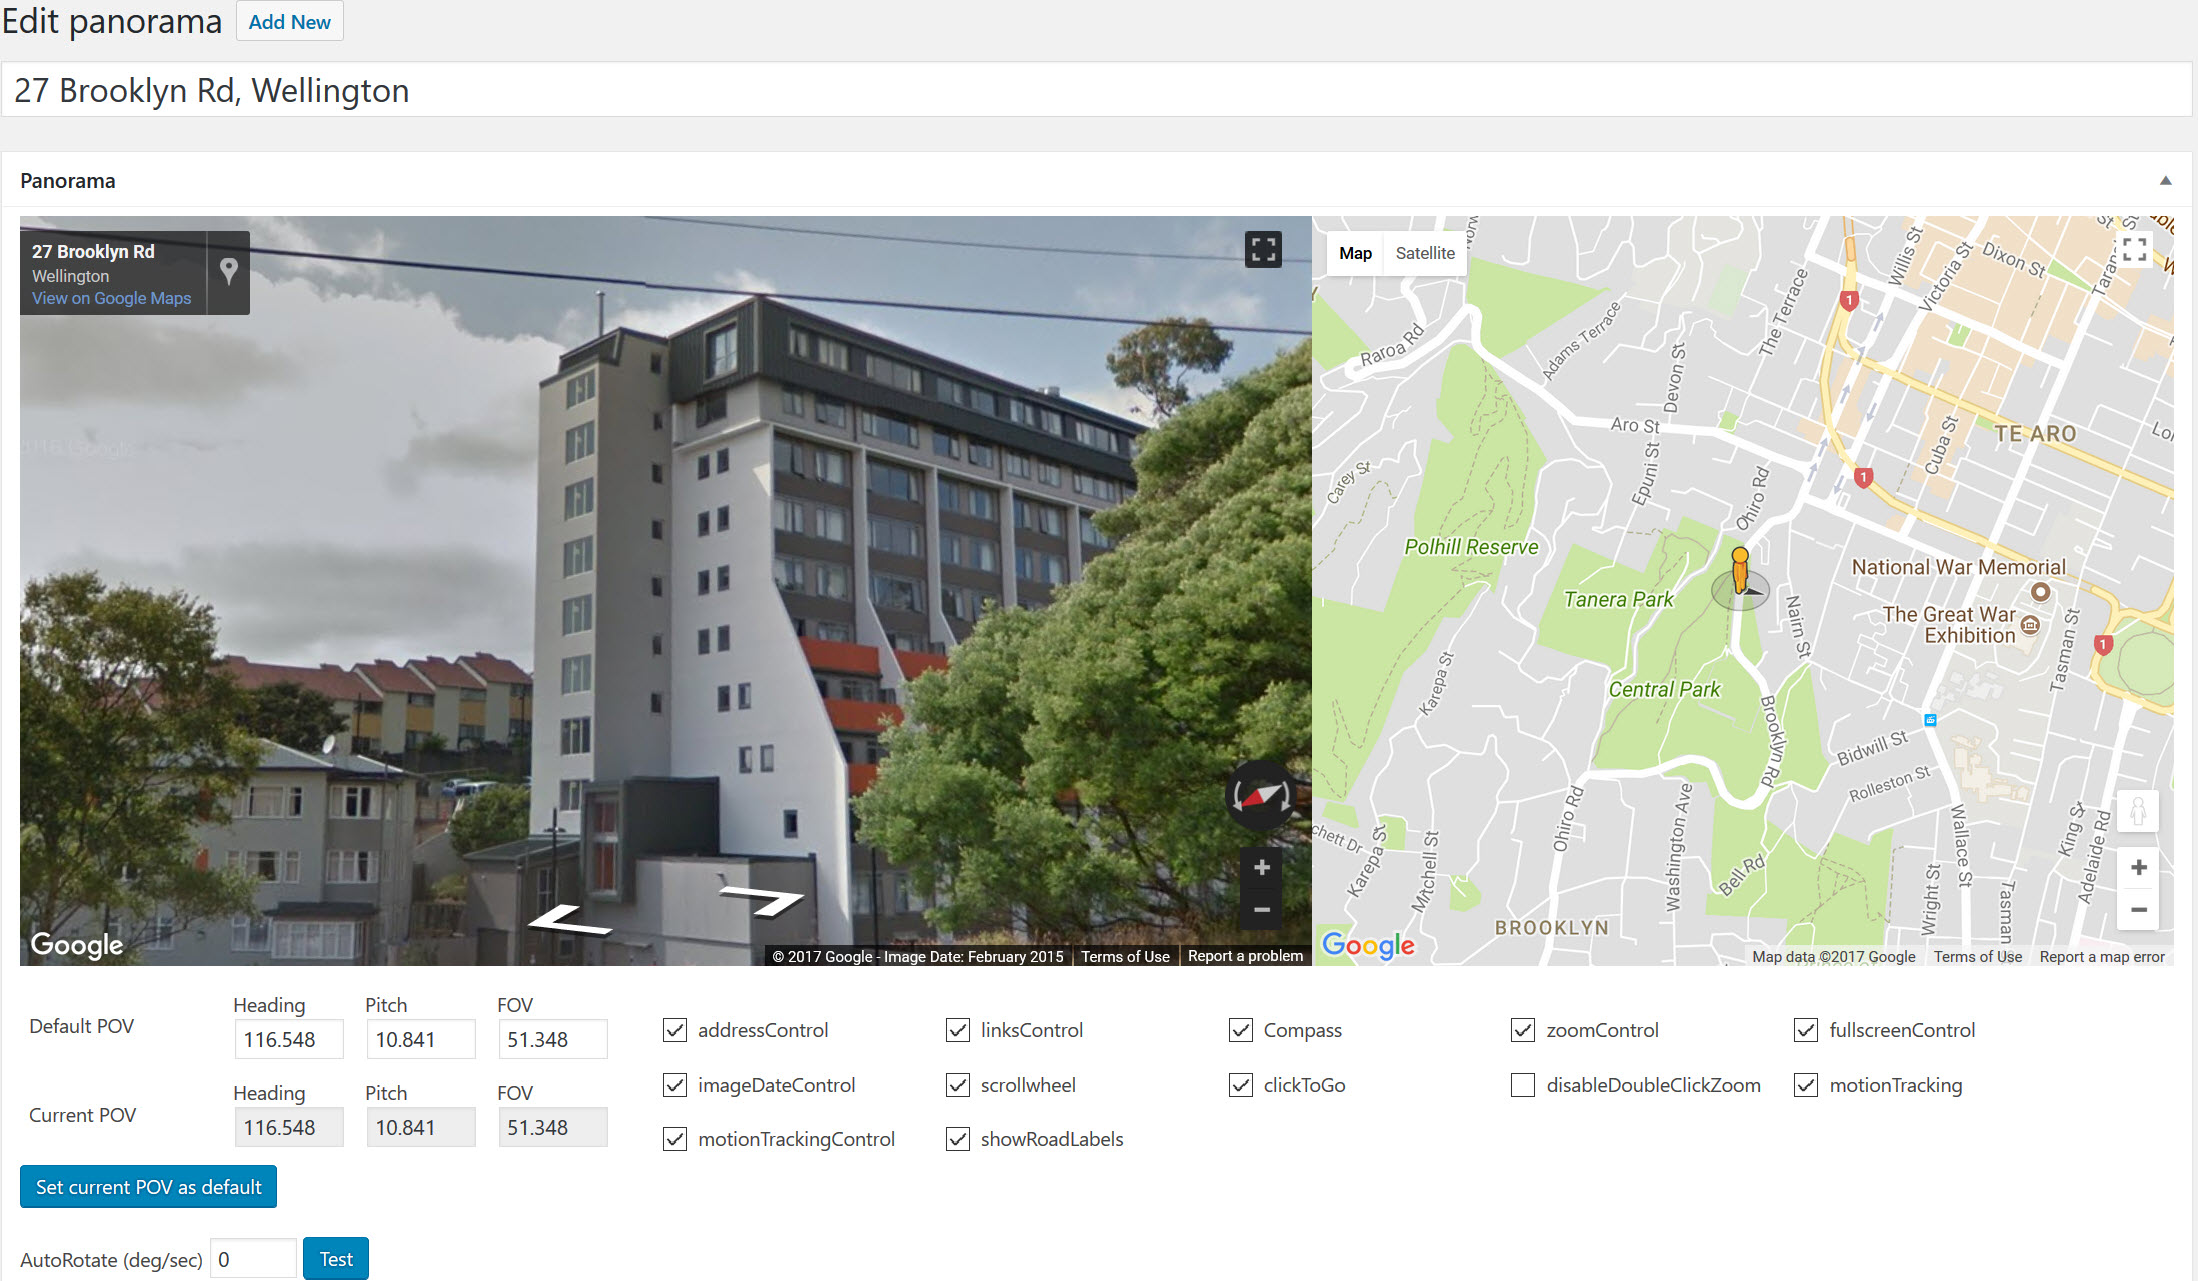
I see panoramic 360/180 pictures as an extremely useful tool for Facility Management. As an Architect who goes to site to capture information on existing buildings and sites, the frustration of having a photo cut off just where you wanted to see something just outside the normal picture frame, usually requiring a 2nd visit to
Hi All, Forum tab next to Home on menu bar. Or HERE I have noted that there seems to be quite a bit of interest from you out there on my openMAINT setup and configuration blogs. Obviously you are interested in the product and interested in getting instances of your own up and running. I
This Survey uses Revit Model Measures to Compare against SPM Surveyed Data of 26 identical apartments. The Survey This is comparison of Duncan Terrace Flats A01 to A26 which are all similar,( some handed so bathroom/kitchens are flipped- see plans below). Each individual flat was surveyed by one of 5 surveyors who had a group
OpenMAINT putting data into system Export/Import Manually putting in data line by line using “cards” can be tedious, especially when data spreads across 3 or more tabs. So openMAINT has a couple of ways to bulk input/update. They are in the Administration Tab under “Utiulities” (at bottom) in LH side bar. You can select a
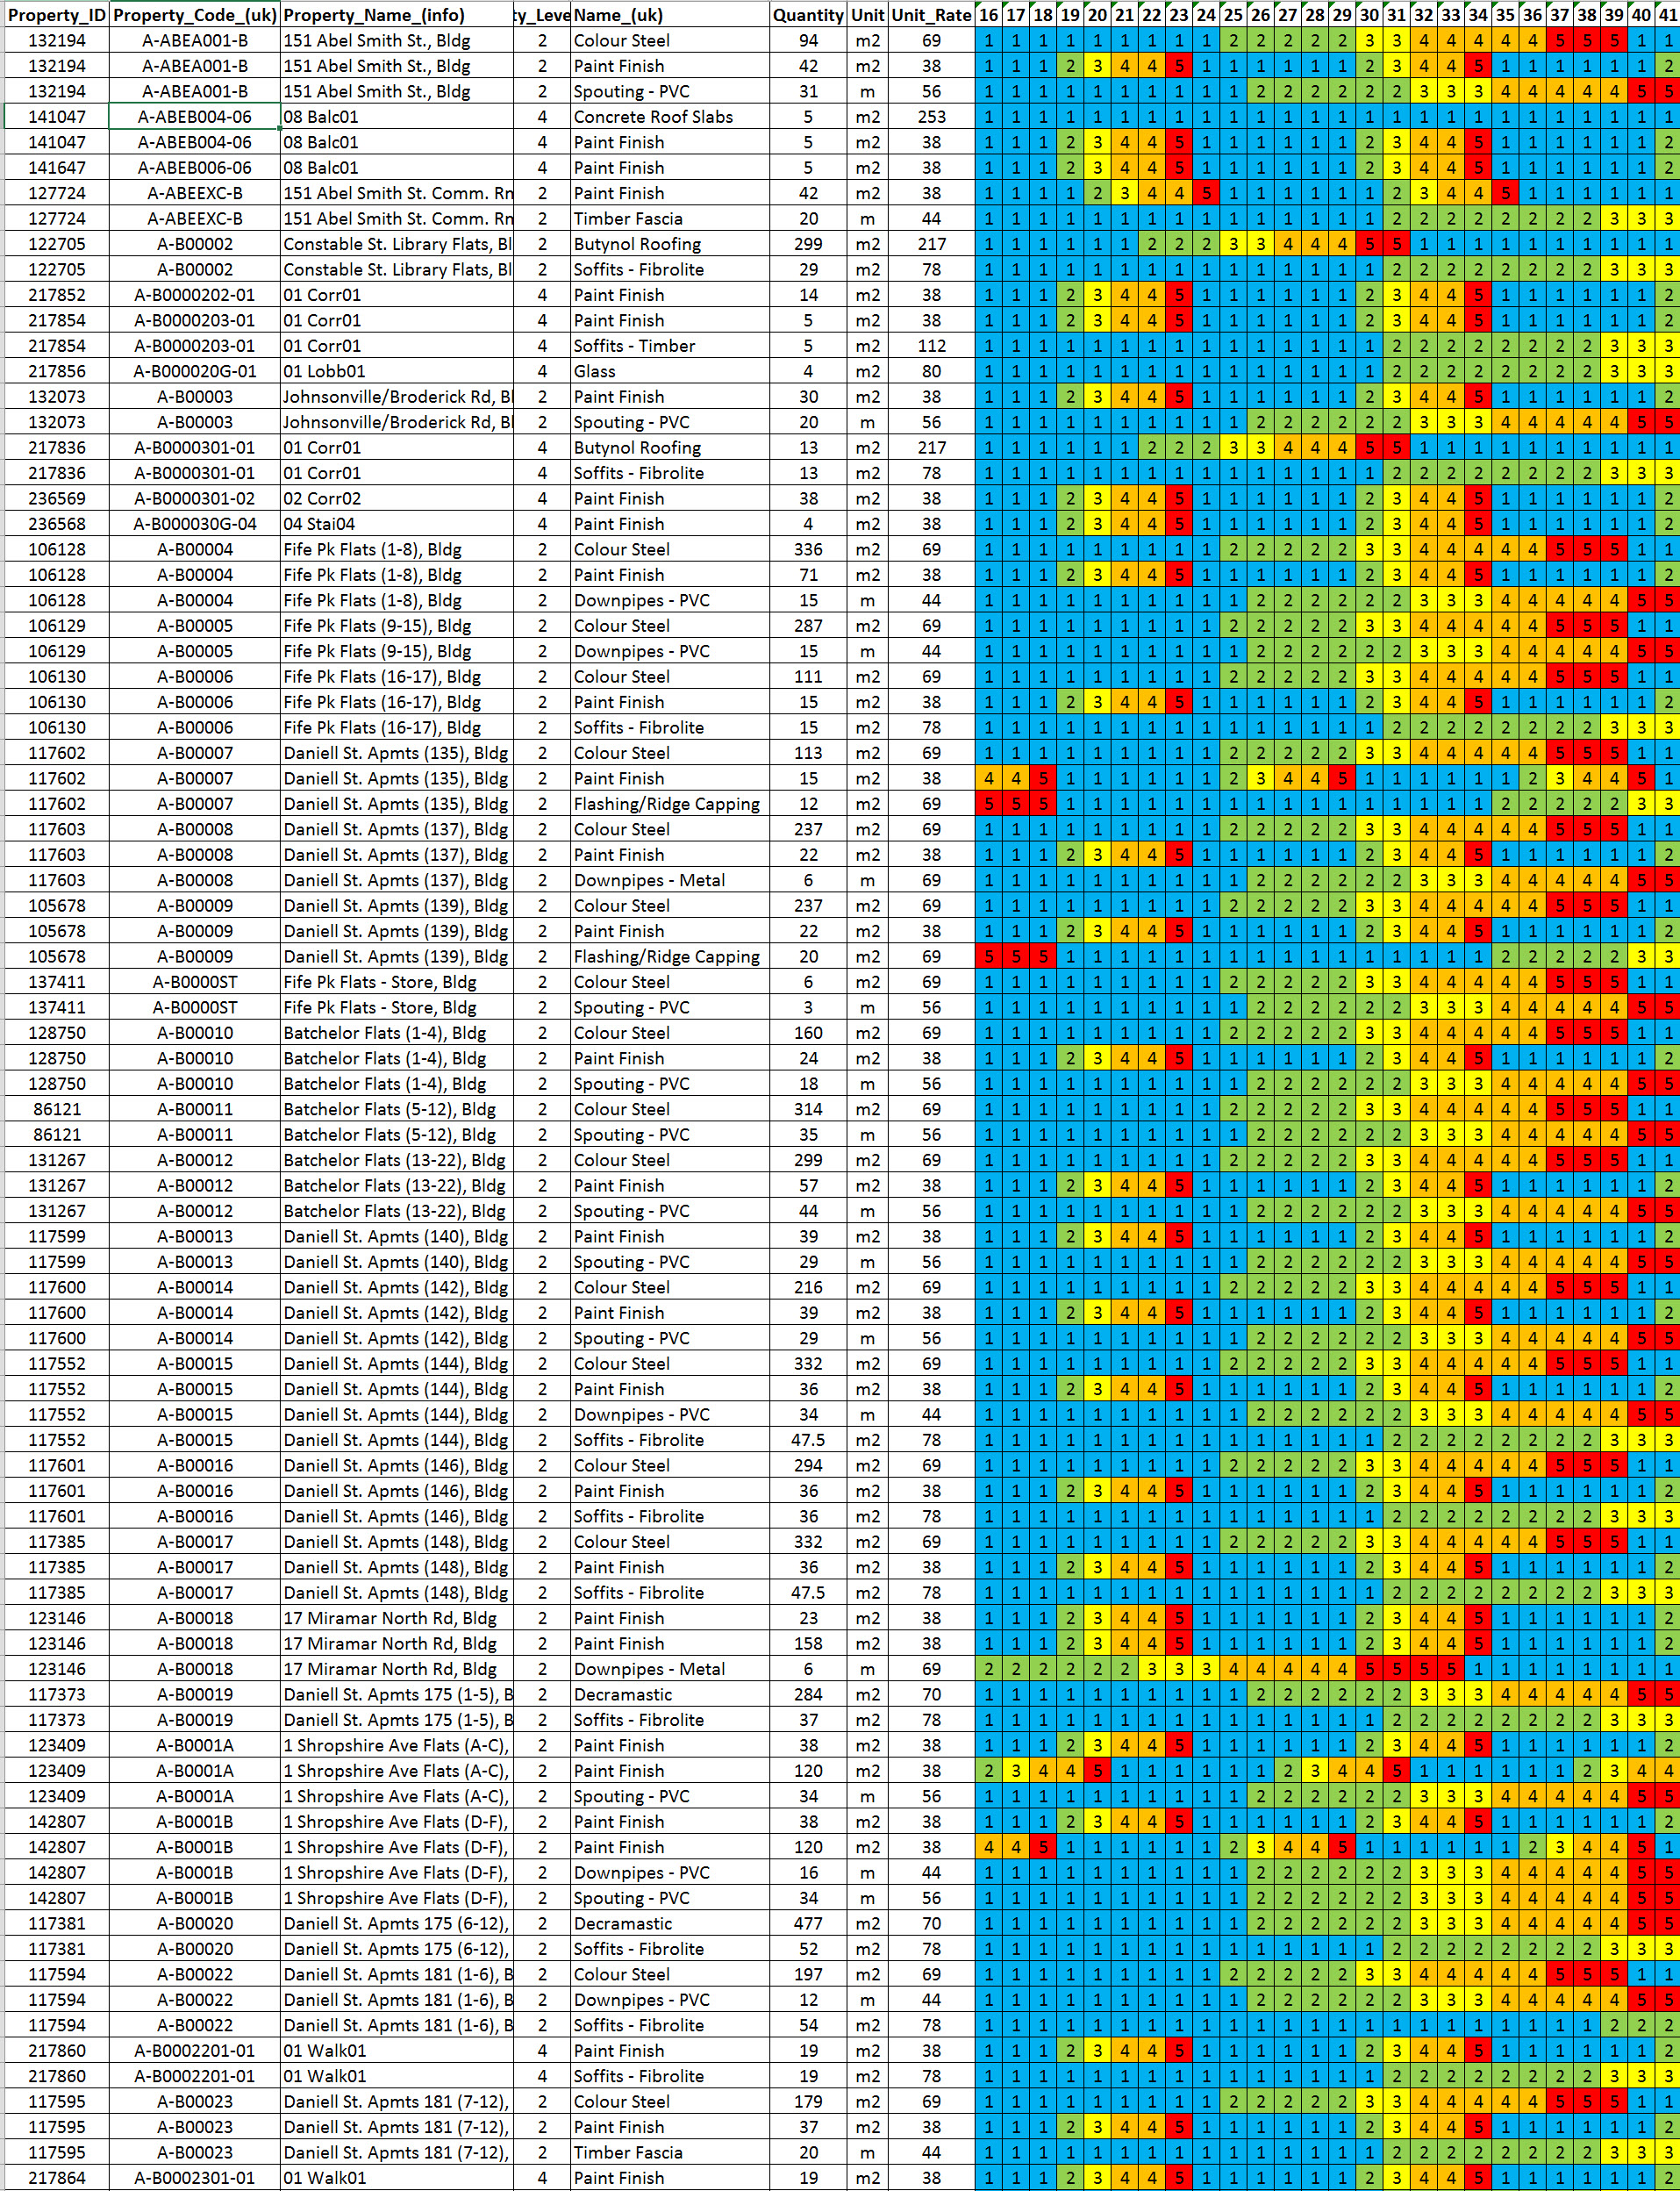
A method for showing condition heatmaps is using Excel to display the condition of the elements over time. Another post Heatmaps for visualising exterior and interior space conditions uses D3.js heatmaps. The good part of this is that you can use filters to explore the information and drill down into the data. Video (4min) I
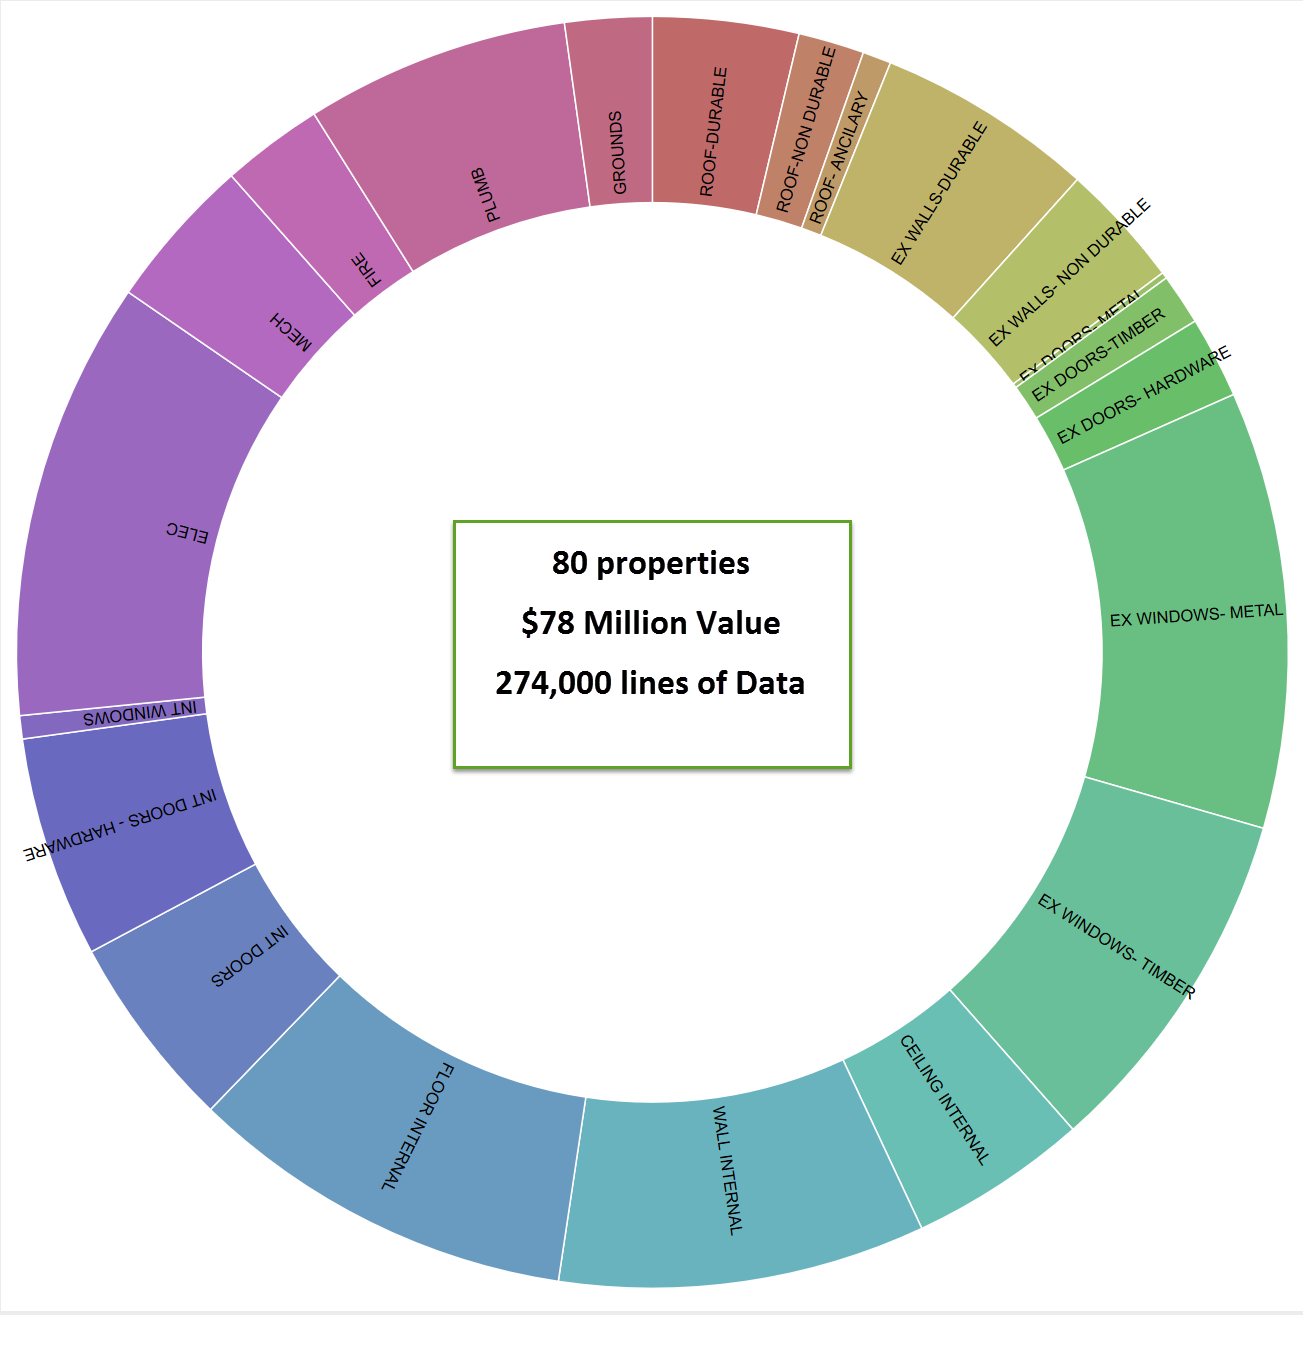
This analysis is based on 274,000 rows of data regarding social housing survey of interior and exterior inspections. It has been filtered for building fabric, services and joinery have been excluded at the beginning. It is a bit of a haphazard blog. I used Knime to filter out the data and slowly filtered building data
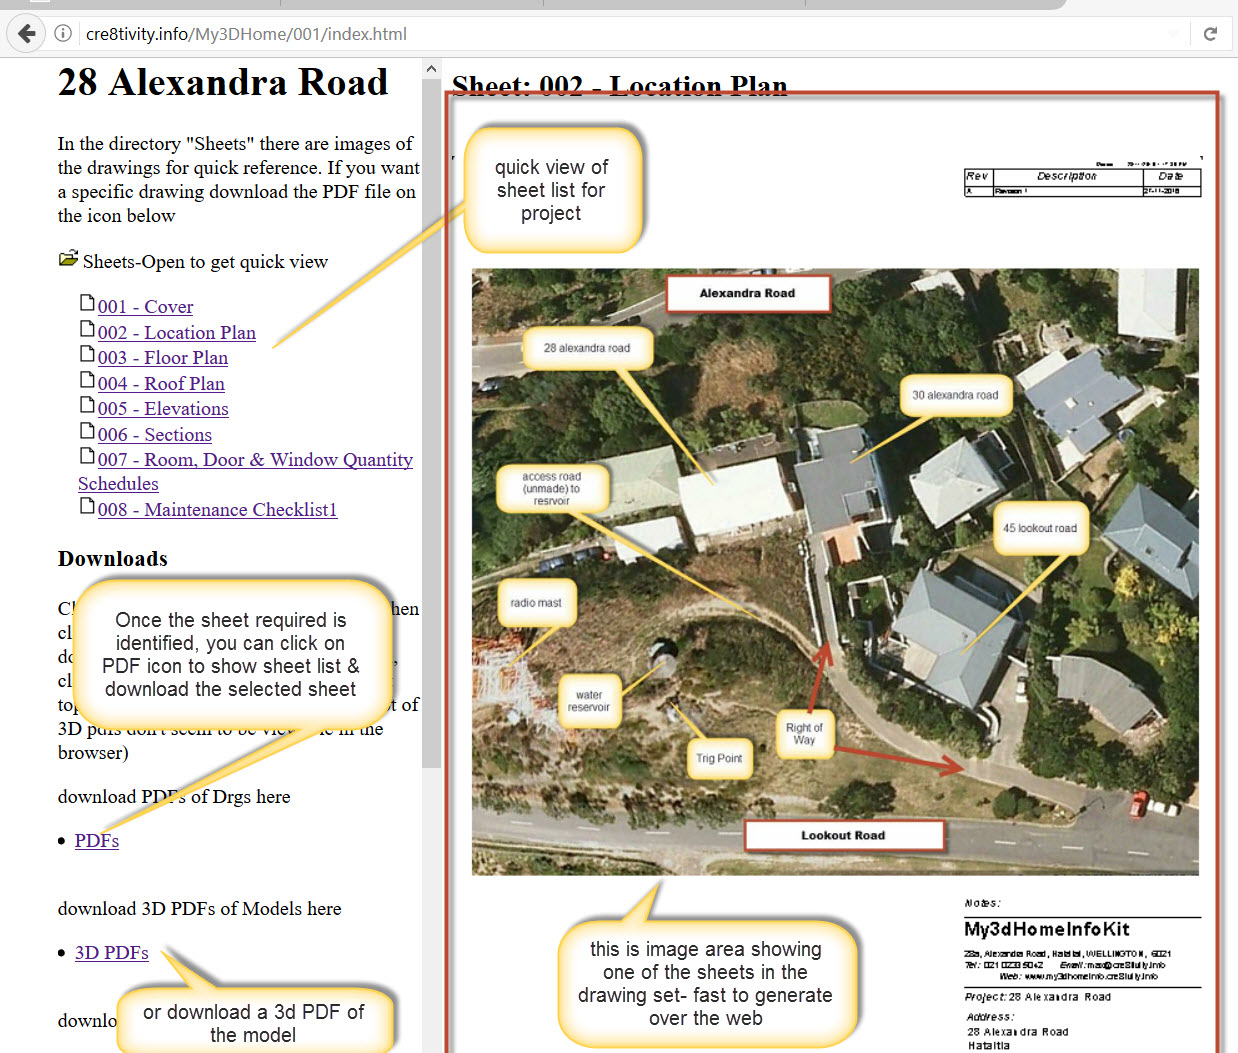
Having access to the information quickly is important. My experience has been that if people try and assume and guess they usually end up doing a lot more work than initially envisaged. Having information early means you can plan and anticipate. Revit creates Web Page with Images This video (7.38min) shows you how to export