Visual Asset Strategic Tools. Capture Building Information for Building Life Management. Open Source/Low Cost Technology Solutions for you to control your buildings
After trying out the Using Walk-Through-3D Free Revit Add-In by AMC Bridge I was interested in the Unity visualisation. I thought, if its that easy why isn’t it being used all the time, after all, for small scale use Unity is free. So I did a bit of research on the topic. The issue is
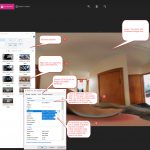
Walk-Through-3D . A nice add in I came across that seems to have developed a lot further than when I played with a similar package in 2015. This walkthrough has a nice appearance and has some extra features such as the map, this helps me navigate around the architecture more easily. From the description of
I don’t usually do ceramic tile finishes, but I’ve just had the opportunity of doing some on a recent project. There are floor tiles and wall tiles and feature tiles for an accessible toilet that I will use as an example. This is near the finished set-out for them, a few more dims and schedules
Capturing auditoria, theatres etc for AM/FM and for ongoing use of the model for seating planning can be useful. With numbered seating you can allocate different prices for different seating, you can also change pricing for different event configurations for multi-purpose arrangements.I have done seating on a number of buildings in Wellington when working for
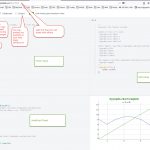
I was looking at an article on The 38 best tools for data visualization and I saw 06. Dygraphs and I thought I would take a look at it. On following the link to it, it also had just play with dygraphs on jsFiddle. So I linked through to JSFiddle and decided to look at that
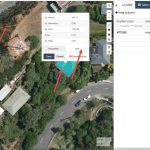
I’d come across this website and thought it was quite interesting. You could put polylines, lines and markers on the map and get the output in geoJson format. So this could be read with a bit of coding and displayed on a map on a website. I have just been having a wee tinker around
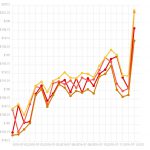
After Stock Data 2. Graph in Excel from Web and Graph from API to web page I had got the Excel Graph working but had fudged the API to Graph process. So, back to the interwongle, and this time I asked Mr YouTube. I got a bit of a lead on using Chartist.js to display
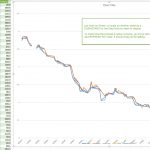
In the previous post “Stock Data 1. Capture via API and Excel from Web” I used Excel to grab some data from the Web & show it as a Table inside Excel. After bringing the data in I had trouble creating a chart from the Table. So, after messing around with the Charts again today
I had a thought of embedding metadata into images after a building survey. This would capture the surveyors comments on the survey and store them in the the actual image files. So the next time the photo is inspected in the office the information on that image is easily inspected. Rather than looking for 2
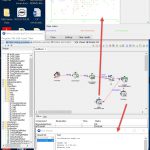
Following on from the first Weka post, which was based on information gleaned from the Data Mining with Weka course that I followed. This post is based on the following More Data Mining with Weka videos. Some of the screenshots below from the video’s that have been developed and are presented by Ian Witten of