Visual Asset Strategic Tools. Capture Building Information for Building Life Management. Open Source/Low Cost Technology Solutions for you to control your buildings
Some programmes and processes that I use to help me work a bit more productively on laptop/desktop. Note Microsoft office & Snagit are not free but gets a mention as I use them frequently. Windows 10 mouse pointer colour Of late I’ve been having issues with my mouse pointer, it disappearing off the screen, or
I have been fleshing out some of the web site content. It has got me thinking. When the earthquake happened in Wellington November 2016 a lot of offices closed and did not re-open until the buildings were deemed safe to use. I recall a few people saying it did not disrupt their work too much
I was thinking of an office resource area that people could go to find information. In a large office there would be an intranet setup that would control that process. I was thinking of something a little more Ad-hoc. A site to easily find information. It might be a resource that you wanted to share
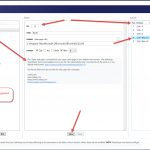
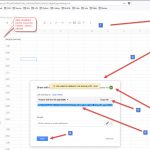
Following on from the previous post I want to try and be able to update a Google Sheet from a web page via the link. I will be following this video: Unfortunately there is not a link to code for this addition, unlike videos 1 & 2 so I’ll need to write it from looking
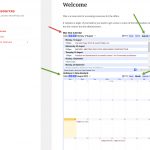
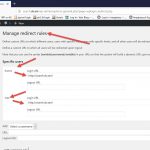
I went along to August WordPress meetup: Maintaining and updating 80+ WordPress Sites talk that was very interesting. The main plugin/tool that was used was Manage WP. Peter Williamson, the presenter, used the paid add-ins to do the maintenance. I have played with the free version that I found a bit limited. Still, that is
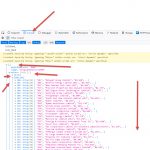
I like it when I find some useful code and it works straight away. When it doesn’t I end up spending an awful lot of time trying to figure out what is happening. turning the programmers dark magic into something comprehensible. Continuing on from the previous post I started to look at the output and
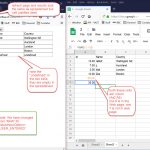
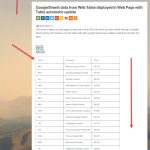
Getting data from the web and being able to manipulate it and display it on your own website. Using Google sheets to refresh the data at specified intervals allows you to get live feed from sites that do not have an API for drawing the data down. At the end of the last post I
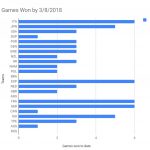
My son in law, Karl Reece is playing in the Canoe Polo 2018 World Championships Welland Canada for team USA. I am very impressed with his accomplishments. Come on USA & NZ. Games played, won/lost based on Groups in table below at the end of 4/8/2018 at Canoe Polo 2018 World Championships Welland Canada. I
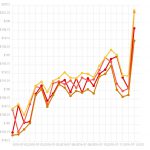
The last few posts have been looking at data from the Web into Excel or using API’s. Then doing some graphics with the data. Excel is a bit static. You have captured the data from the web and you have to send someone your workbook to view. They may not update the data, so it
After Stock Data 2. Graph in Excel from Web and Graph from API to web page I had got the Excel Graph working but had fudged the API to Graph process. So, back to the interwongle, and this time I asked Mr YouTube. I got a bit of a lead on using Chartist.js to display