Visual Asset Strategic Tools. Capture Building Information for Building Life Management. Open Source/Low Cost Technology Solutions for you to control your buildings
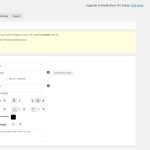
Continuing the development of the site, a few more issues came up. Product Image Size I had an issue with the product image proportions being more portrait than square, that didn’t suit the images I had made for the site. I have since found a setting in the theme that lets you adjust the proportions
I have a couple of demonstration sites. Vast & Property Information. These are sites that I use to demonstrate certain functions of a programme or to display results. Early on I started with a Google Map that I applied data over. For some reason, it is a bit sensitive on my VPS site and doesn’t
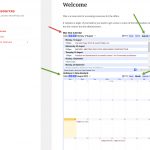
On with the plot. I’m setting up a service based website with WordPress Woo Commerce site with Local by Flywheel. Copying Site from Local to Host Site Before I get too far with local I want to transfer a copy of my site to the new site I have set up on my VPS (Virtual
The plot. Selling services for Data Capture for Facility Management clients. The initial idea was building an Intranet/Extranet site but then I realised that I had built a site called PiP (Property Information Package) that offered data capture information for domestic/commercial clients, planned for Wellington properties (where I could actually visit) and I pulled it
Web Scraper I was looking at Firefox addins and came across a couple of web scraping add ins. Data scrapper and web scraper. The first one I couldn’t get working and the 2nd one I had to watch a video before I could get the settings sorted. Recently, about 4 months ago, I added a
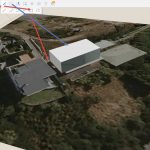
I came across FormIt as a link in Revit 2019 when I started working with Shand Shelton Architects. I thought I’d give it a look. I am using the on-line free version to test out. Go here. It seems to be a SketchUp/ BricsCad Shape type product with Push Pull for Shape forms (so a
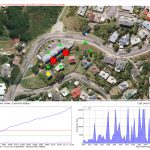
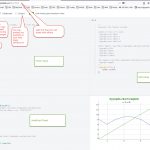
I was looking at an article on The 38 best tools for data visualization and I saw 06. Dygraphs and I thought I would take a look at it. On following the link to it, it also had just play with dygraphs on jsFiddle. So I linked through to JSFiddle and decided to look at that
I have been going along to Wellington JS meetups. The last one was Konstantin Raev “Using Open Source responsibly: why Yarn was created“. His talk was focused on React Native and Yarn as a download of packages versus npm. He gave some interesting statistics of how popular npm was compared to other package managers and
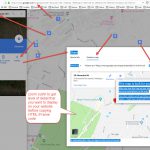
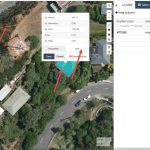
I’d come across this website and thought it was quite interesting. You could put polylines, lines and markers on the map and get the output in geoJson format. So this could be read with a bit of coding and displayed on a map on a website. I have just been having a wee tinker around
I have been fleshing out some of the web site content. It has got me thinking. When the earthquake happened in Wellington November 2016 a lot of offices closed and did not re-open until the buildings were deemed safe to use. I recall a few people saying it did not disrupt their work too much