Visual Asset Strategic Tools. Capture Building Information for Building Life Management. Open Source/Low Cost Technology Solutions for you to control your buildings
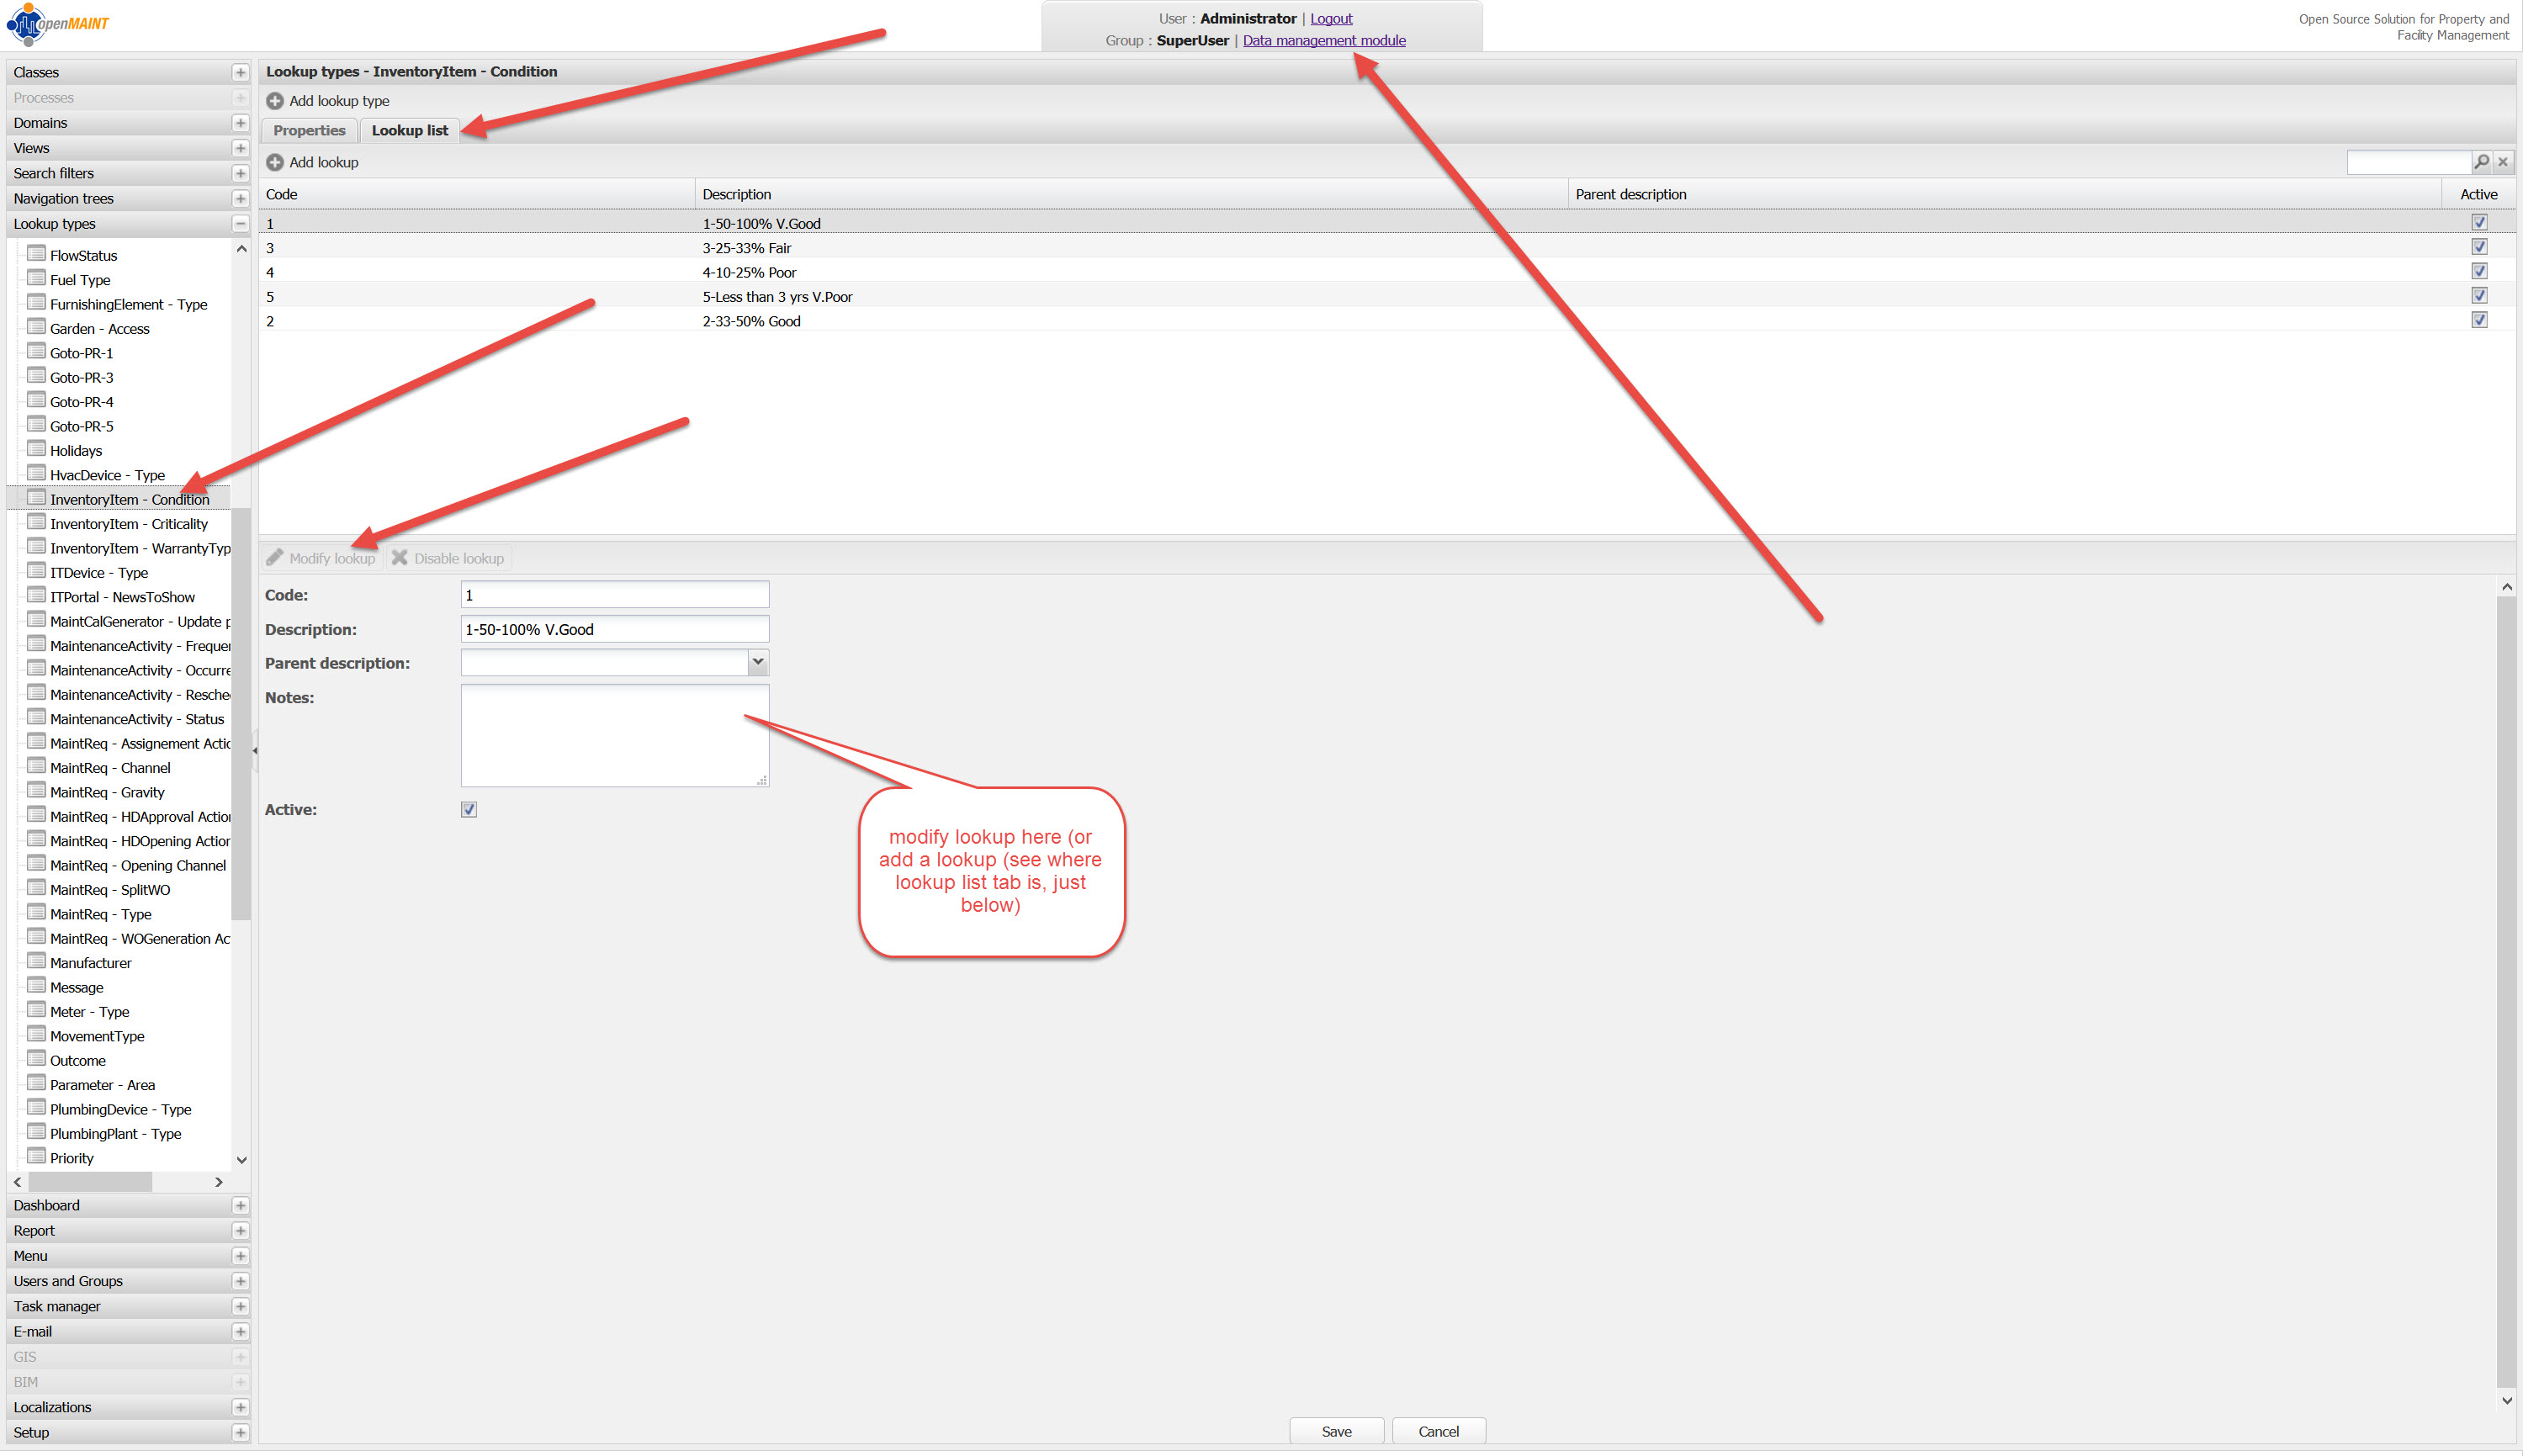
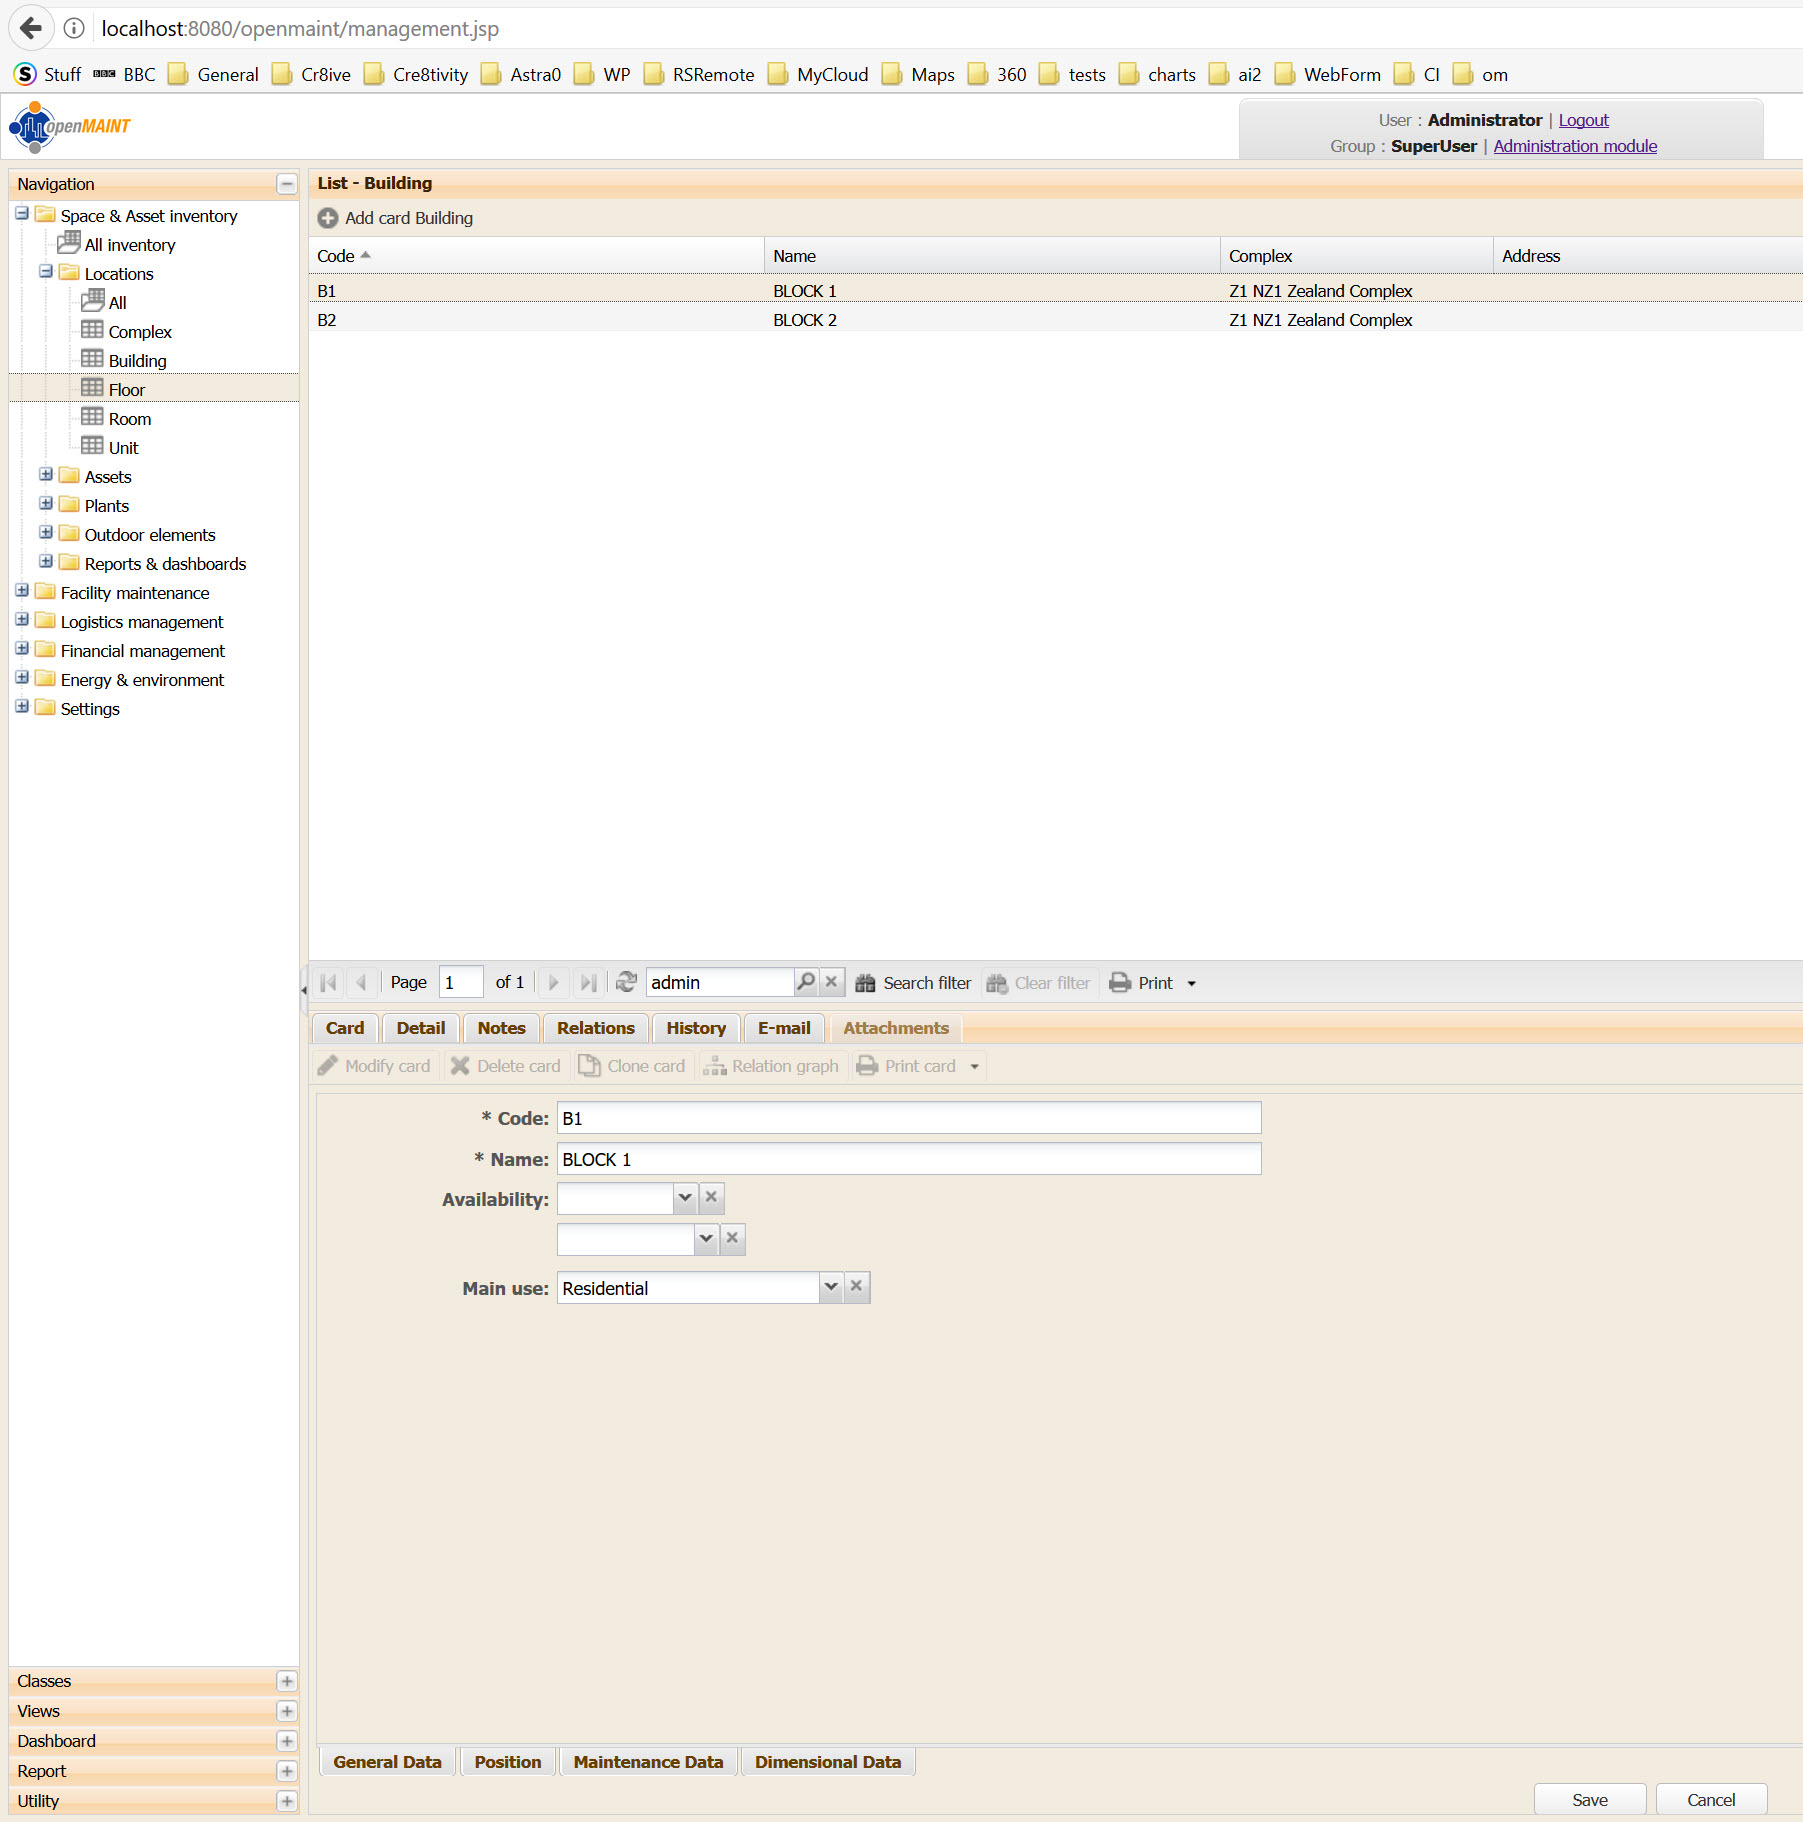
After setting up the basic installation of openMAINT, I now want to look at how to configure it to the way I want. Condition of Assets The first thing that bothered me was the condition levels and where they are applied. I noticed on the demo that the buildings had a condition on them. This
This is a follow on from my previous blog on setting up openMAINT on a PC, HERE. After the setup I want to write about issues configuring openMAINT Background (you can skip this) Matt Cantwell and his merry team at SMRT Consulting set up a openMAINT on a VPS using Linux so I thought I
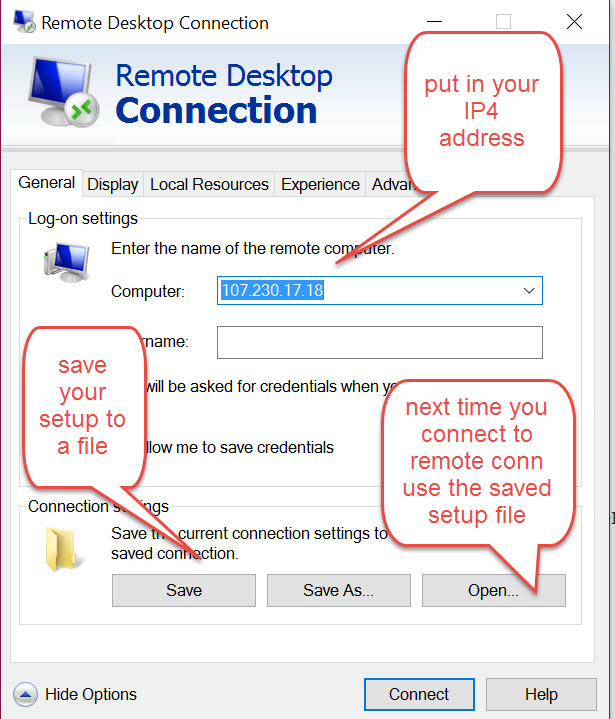
How to setup openMAINT on localHost (own PC) and on Remote Server (in a later blog) from someone who had quite a few false starts. This blog starts with the basic setup and hopefully it will develop to the extra parts that make it so interesting. This is based on OM version 1.1 (core
Where we left off at end of Part 1. Part 2. How to get the search tool working. I tried to code myself, adding to what I had already achieved, but spent a day going around in circles. Then I came across this : Weblesson Datatables Jquery Plugin with Php MySql and Bootstrap. This was
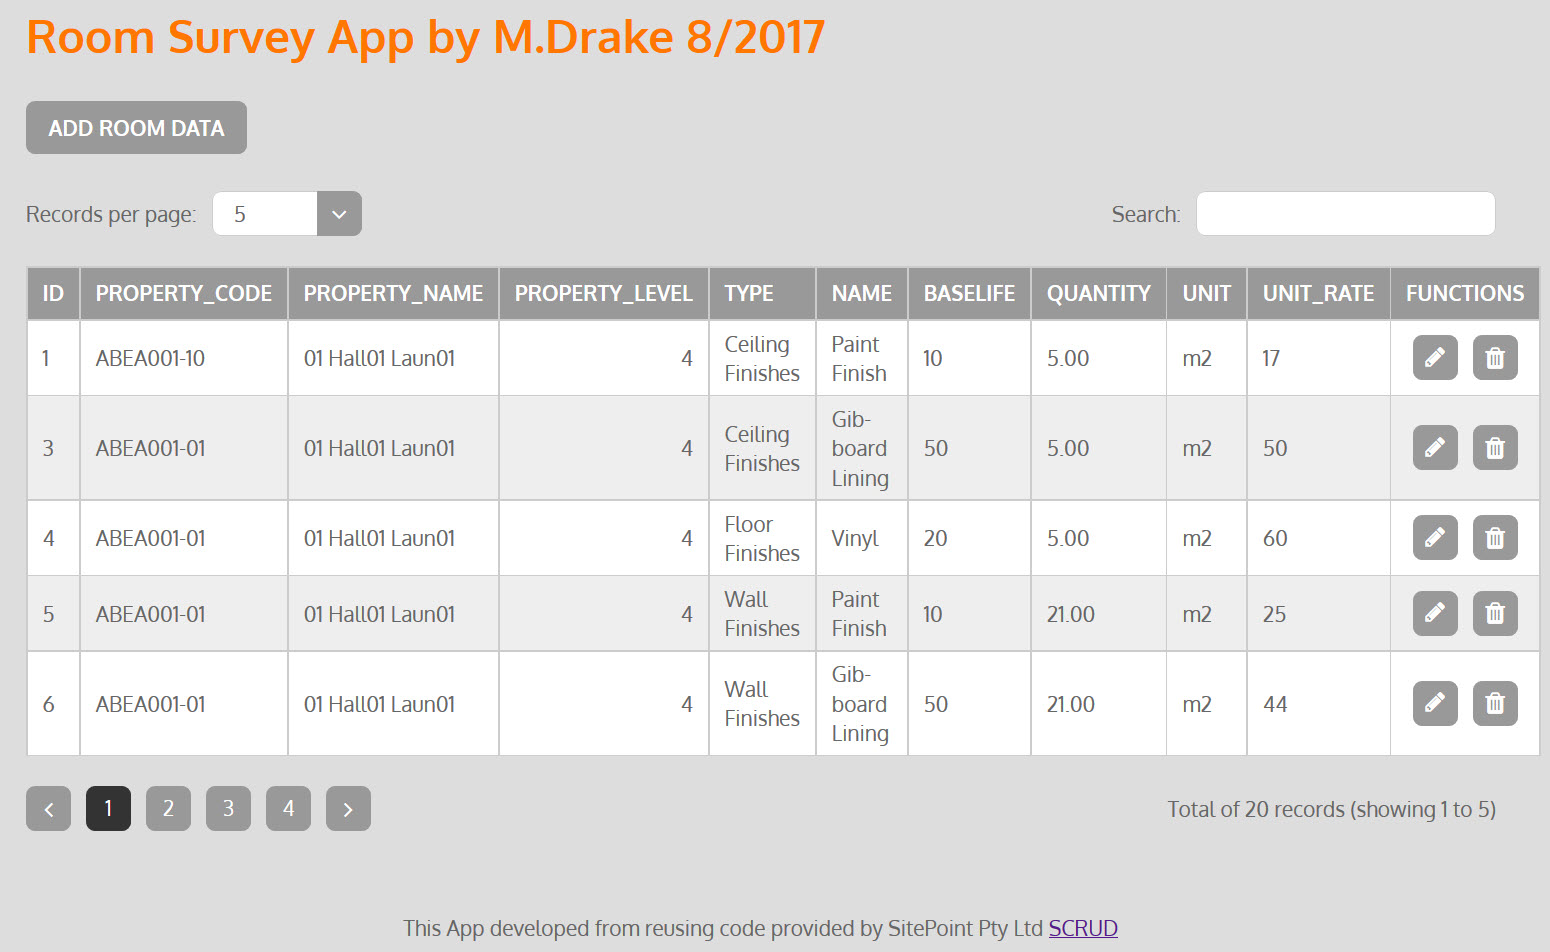
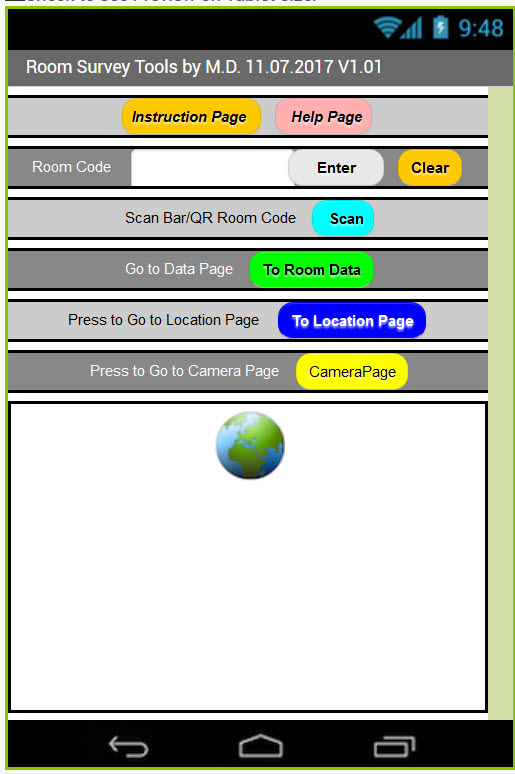
Of all the Asset/Facility Management visualisation development tools I have been exploring, I felt the need to develop an app that can be used on mobile devices for site & room surveys. This is the one item that a lot of commercial FM systems offer. Even OpenMaint you have to have a subscription for using
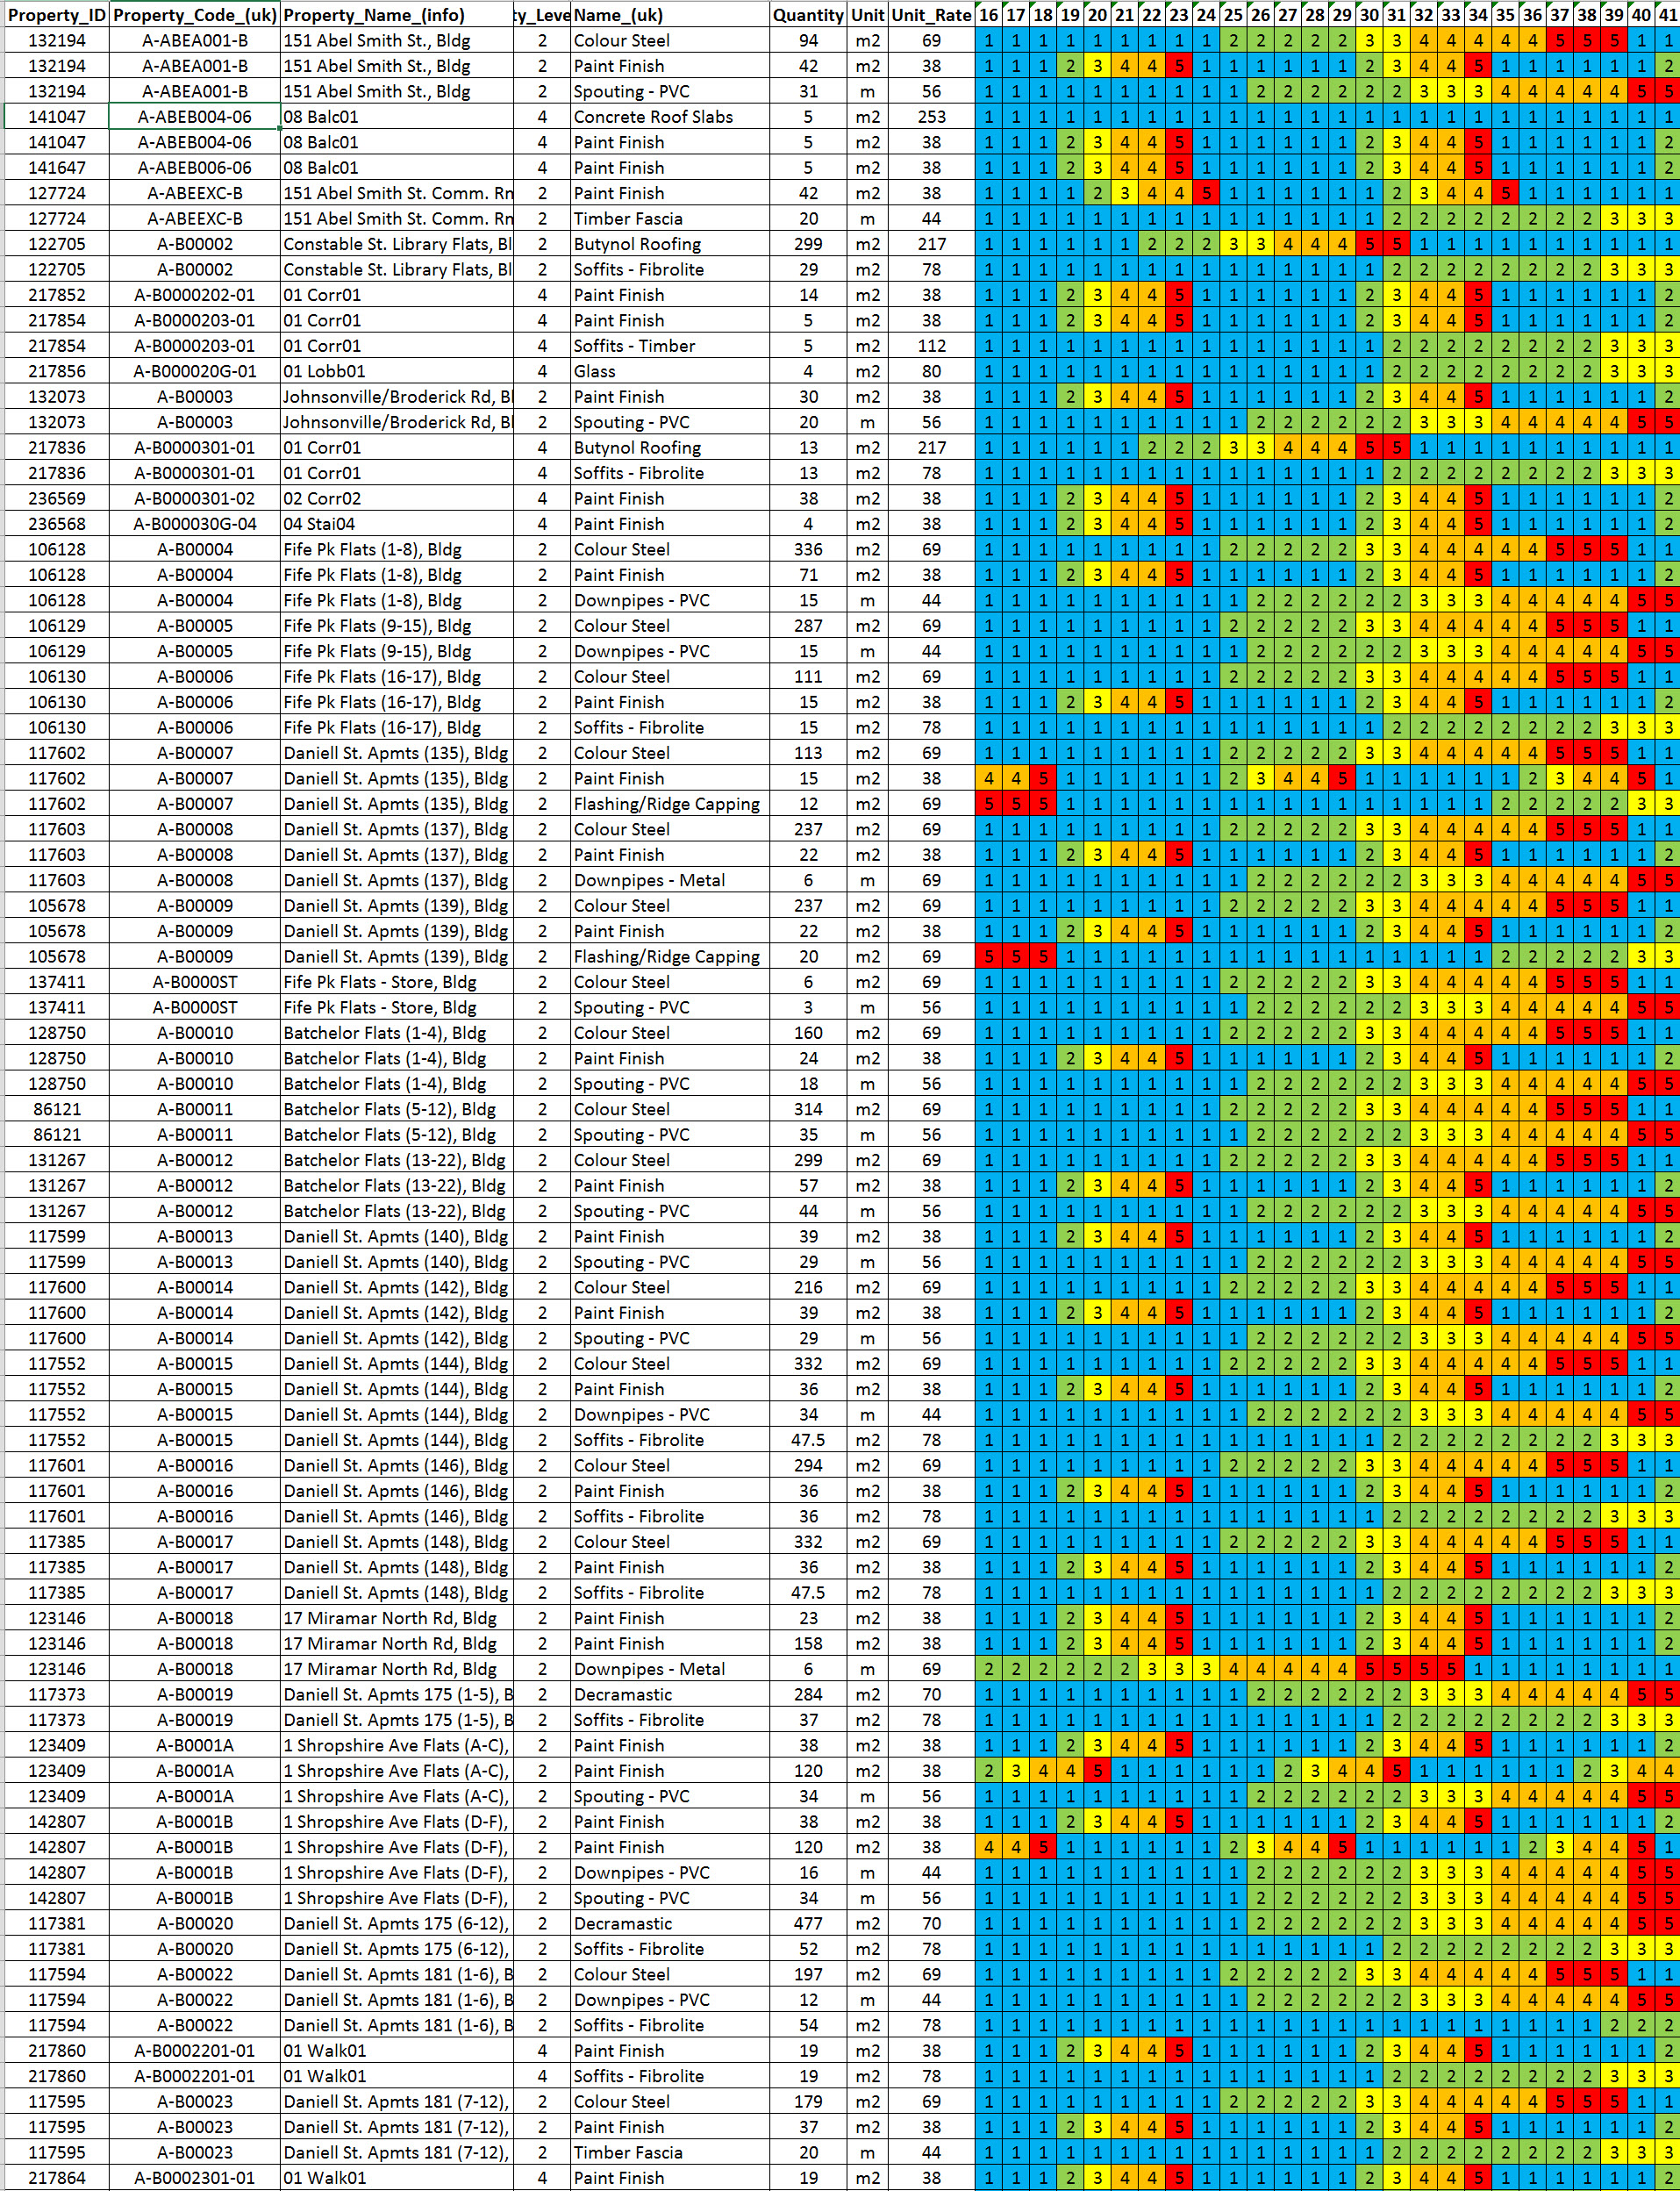
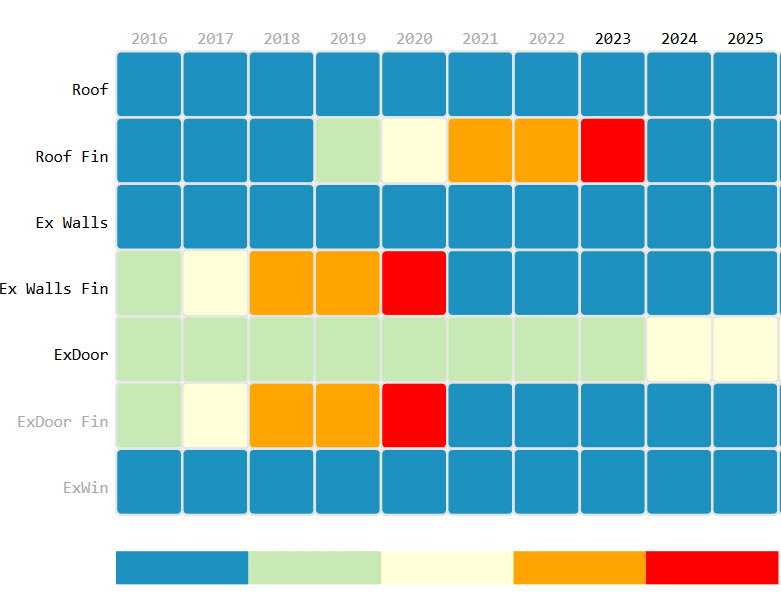
A method for showing condition heatmaps is using Excel to display the condition of the elements over time. Another post Heatmaps for visualising exterior and interior space conditions uses D3.js heatmaps. The good part of this is that you can use filters to explore the information and drill down into the data. Video (4min) I
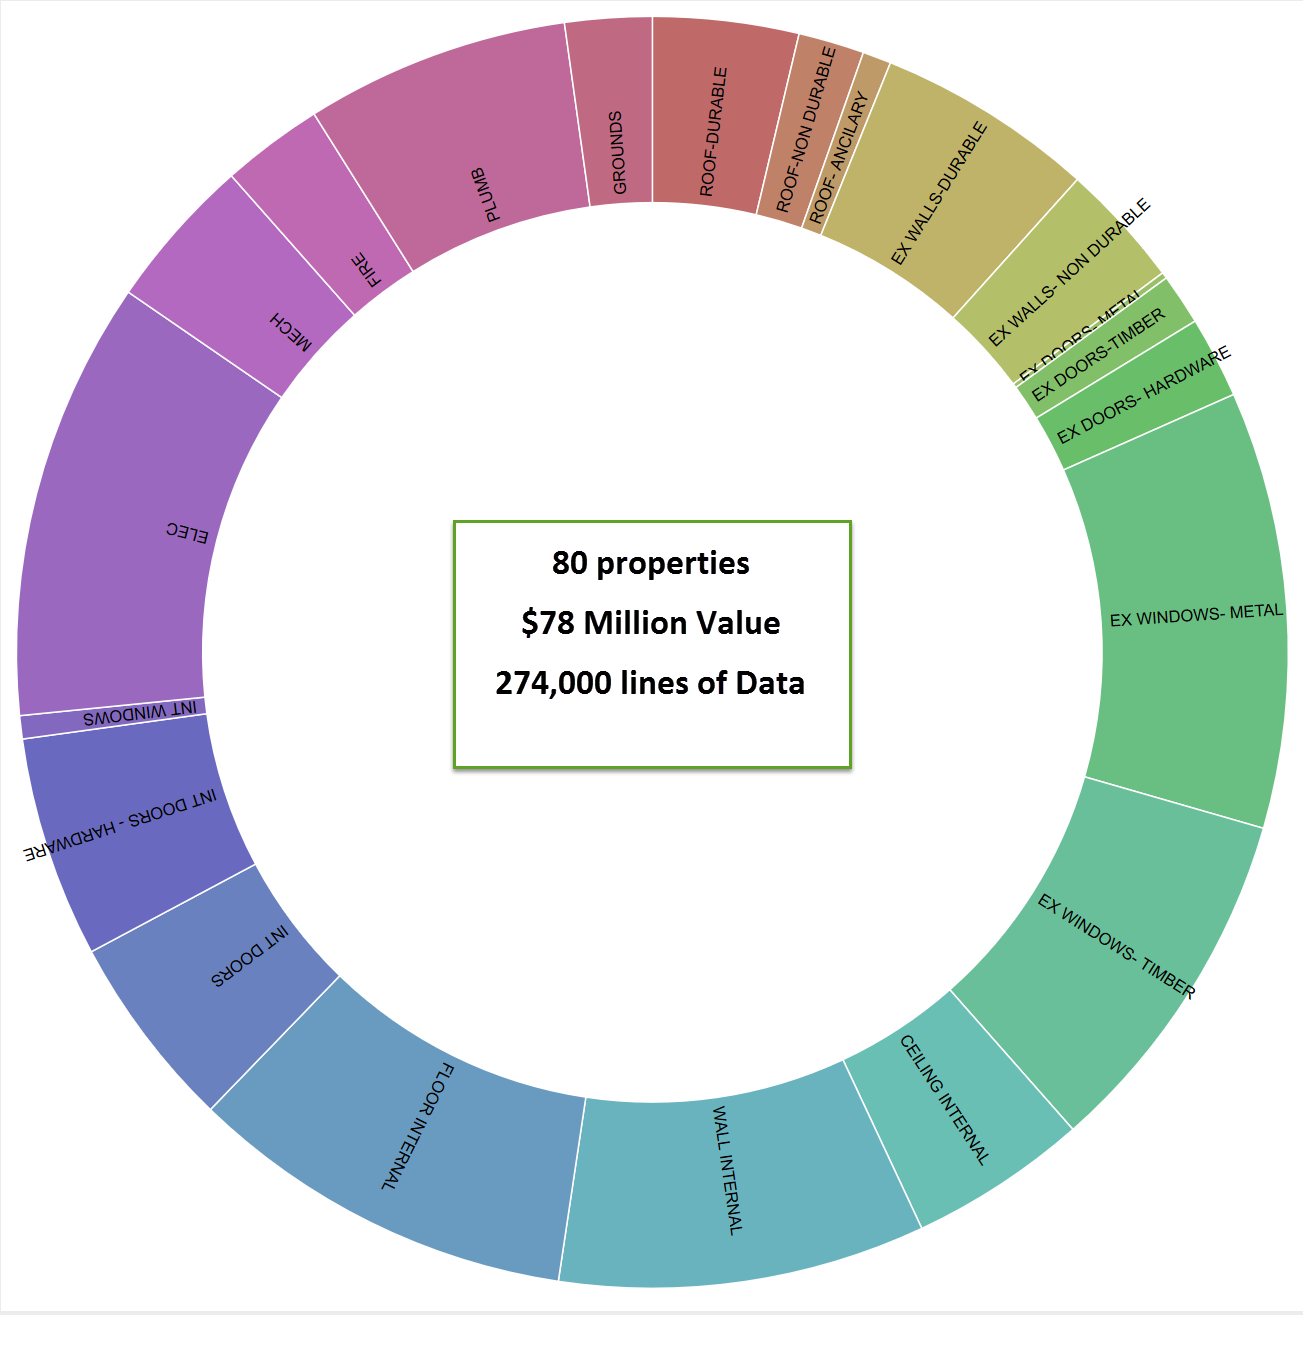
This analysis is based on 274,000 rows of data regarding social housing survey of interior and exterior inspections. It has been filtered for building fabric, services and joinery have been excluded at the beginning. It is a bit of a haphazard blog. I used Knime to filter out the data and slowly filtered building data
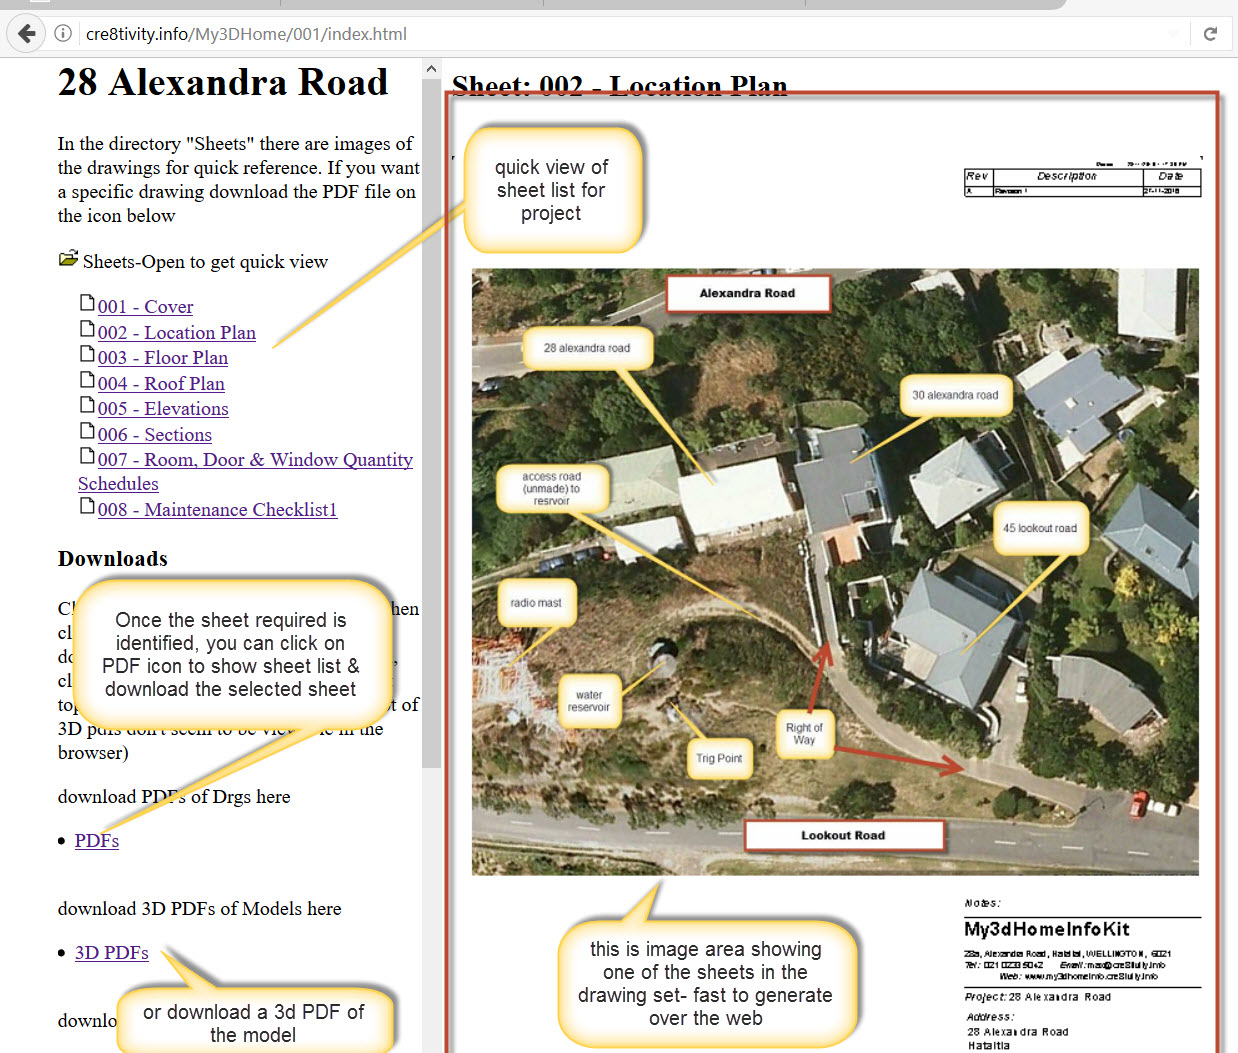
Having access to the information quickly is important. My experience has been that if people try and assume and guess they usually end up doing a lot more work than initially envisaged. Having information early means you can plan and anticipate. Revit creates Web Page with Images This video (7.38min) shows you how to export
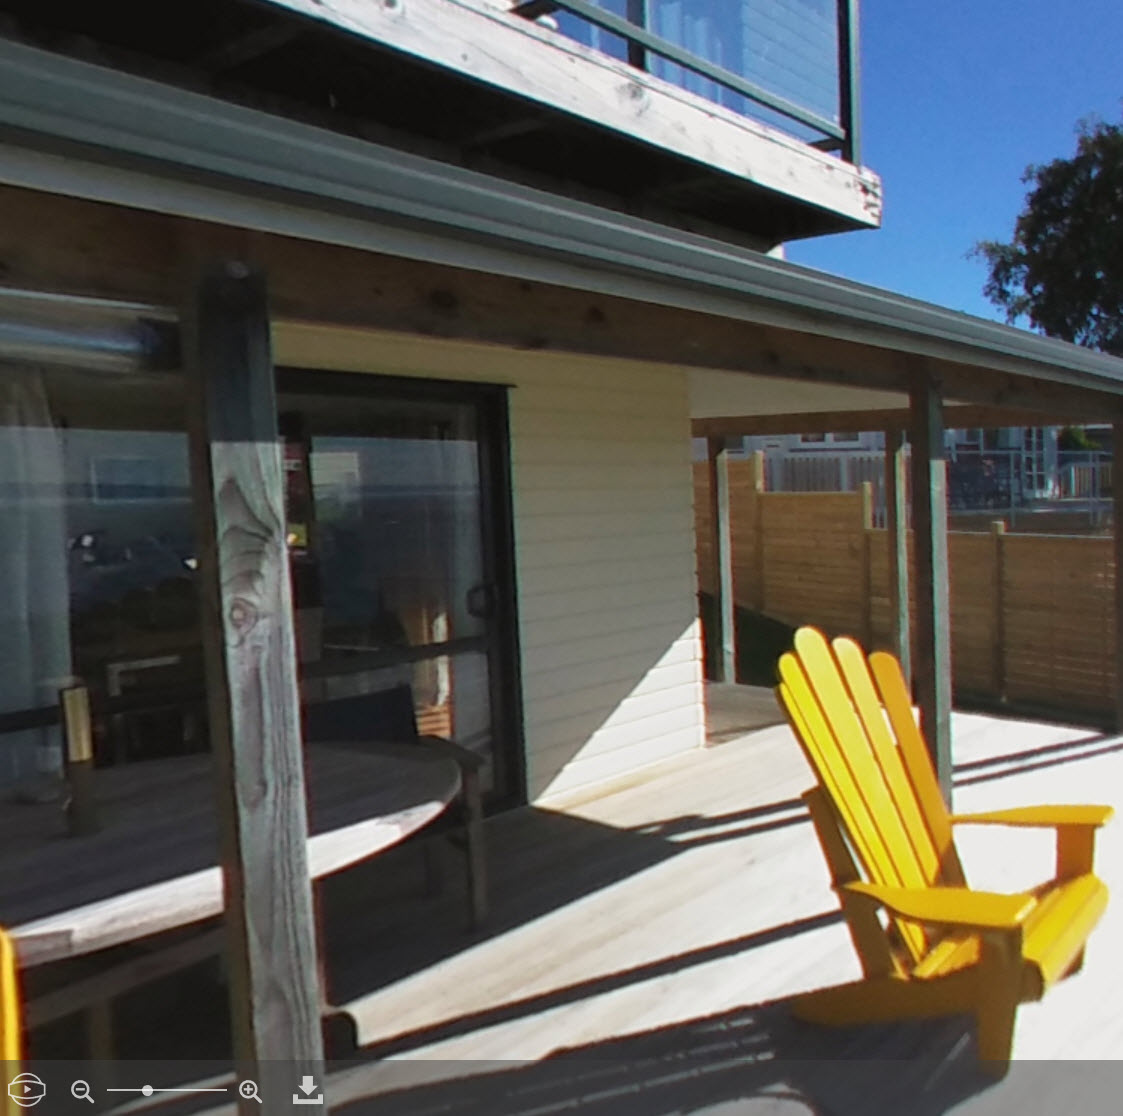
Video (5min) Your browser does not support iframes. Your browser does not support iframes. A quick survey method, where a general overview is required quickly, would be to use 360/180 degree panoramic photos. These are good to quickly identify conditions in spaces and also relationships with other rooms (through doorways) and to show items
We can use the Map overlay icons to show condition of external elements over time (link) and use the location intelligence of satellite and street view to explore the micro-climate and materials on the building. But what about internally? One exercise was to use Revit to show condition at each different year and export the