Visual Asset Strategic Tools. Capture Building Information for Building Life Management. Open Source/Low Cost Technology Solutions for you to control your buildings
A rather long video but I wanted to display a map from a Flask App in a subdomain on the web. The map shows the transit route of a bus for Metlink in Wellington NZ and uses the General Transit Feed Specification structure for its API. On the map it shows the route of the
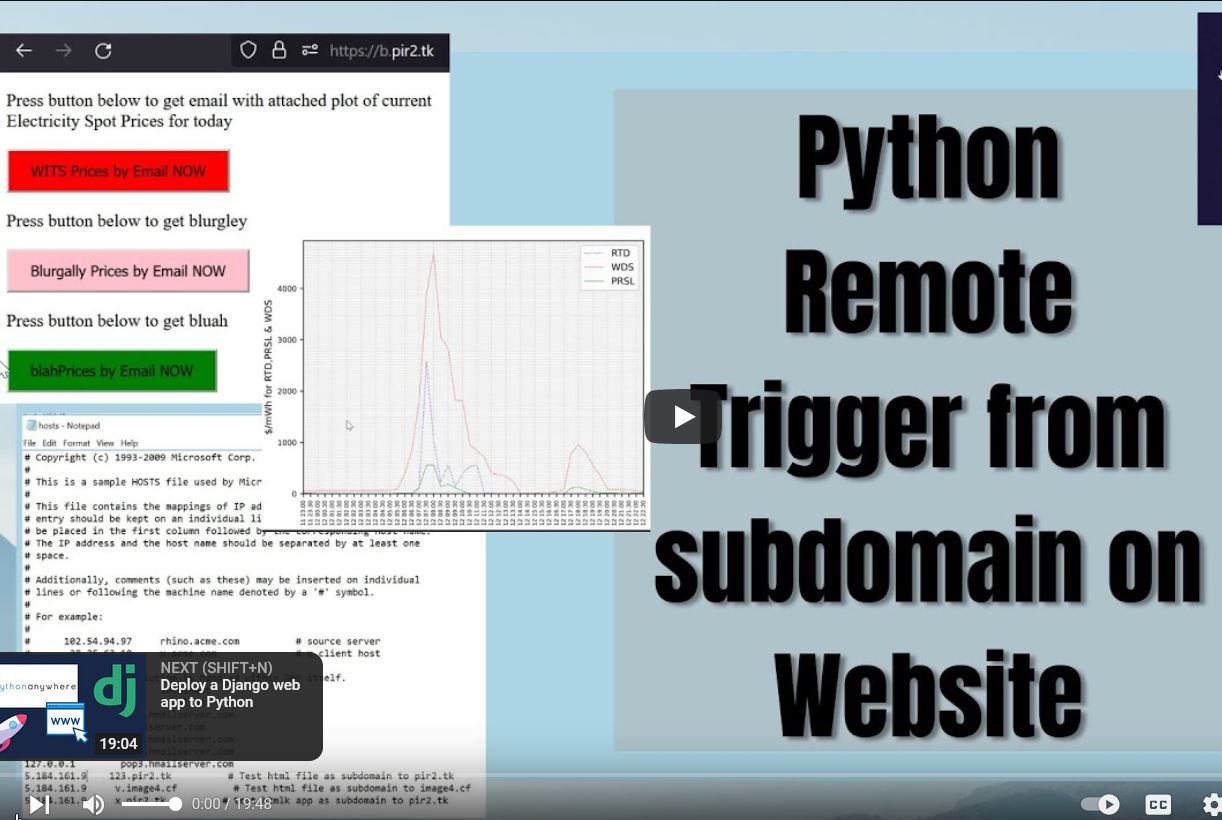
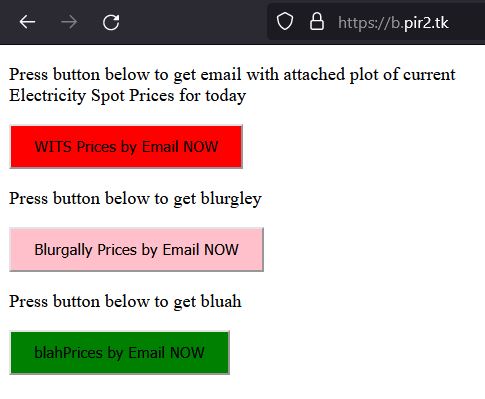
Following on from the Python Remote Trigger Scripts at variable User Selected Times video where I did a button from a IP address website, I wanted to create a website on a SUBDOMAIN of one of my existing Domains.In this video I show how to set it up for Windows Server IIS so that it
I’ve got some automations, such as getting daily electricity Spot Prices emailed to myself on a PDF chart sent to me at specified times, in this case daily at 6am using Task Scheduler on the server to run scripts at the specified time. I wanted to be able to run them at a time of
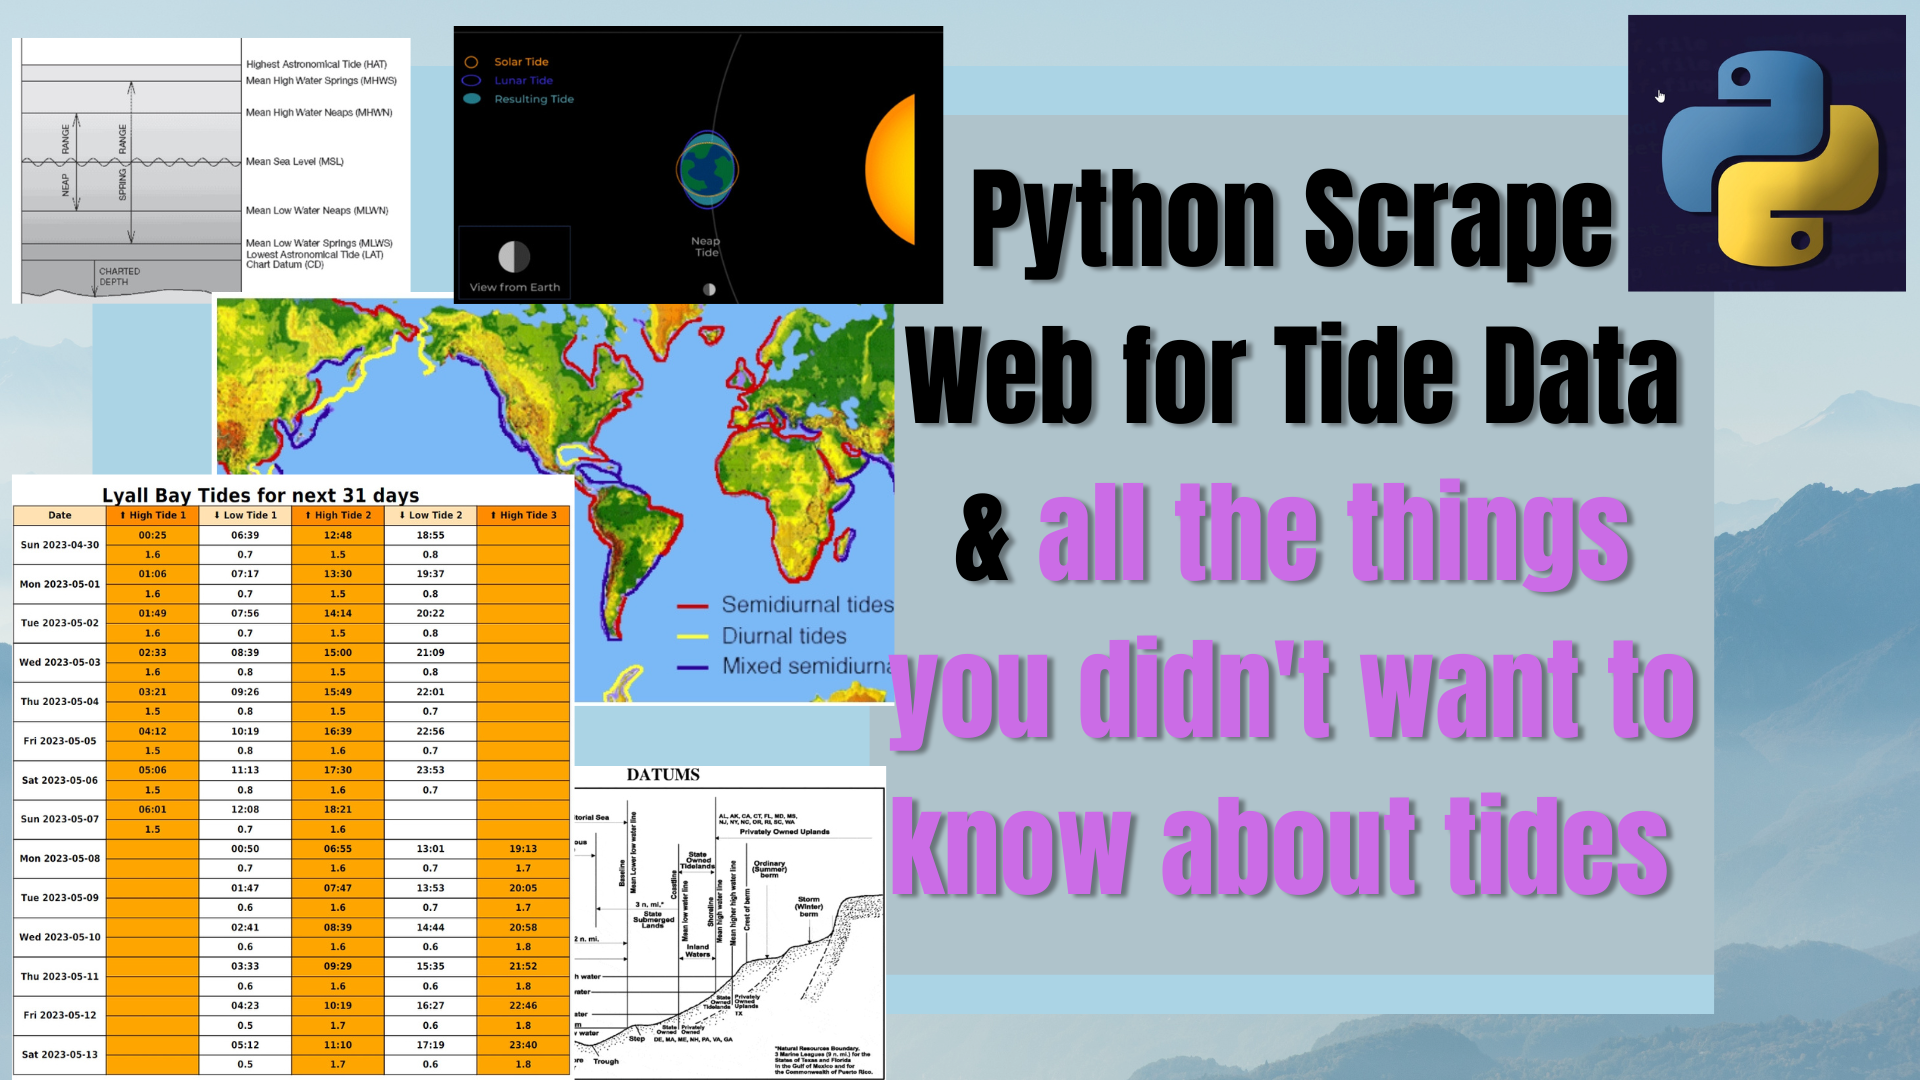
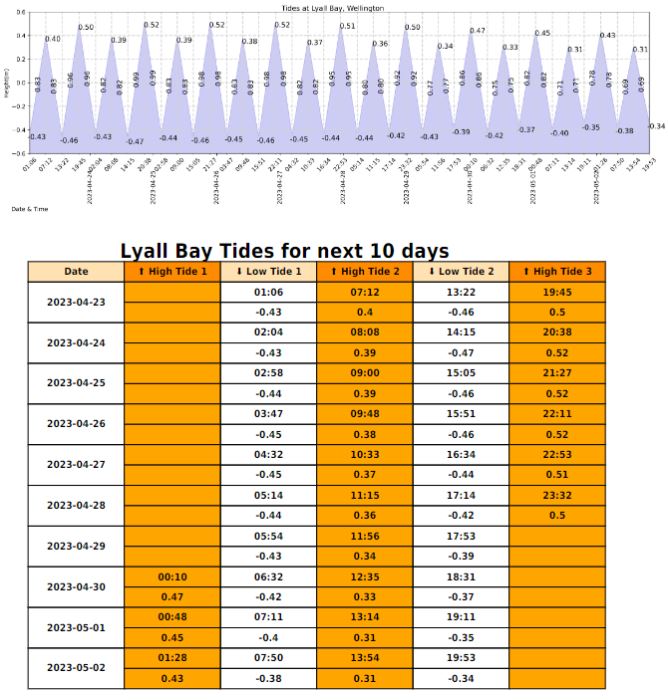
I have been doing work on my bespoke Epherems data using either Python libraries or API’s to fetch the data, so I thought I’d explore getting web data via web scraping process. This is not something I’m keen on as I’ve had a lot of frustrations with the method in the past, but thought it
This is the next part of daily download data via email, to do with tides on the beach that I regularly walk the dog. Using Bing crosby (aka Bing Chat) to find the solution This was a bit of a challenge as I was doing an experiment with Bing Crosby (aka Bing Chat) to see
This one is a bit backwards. My first focus was on automating a URL link with a python script and /or a image/logo/watermark that can be positioned where you specifically want on a page. This ended up not being as easy as I’d initially thought. fpdf library for creating url & image links in new
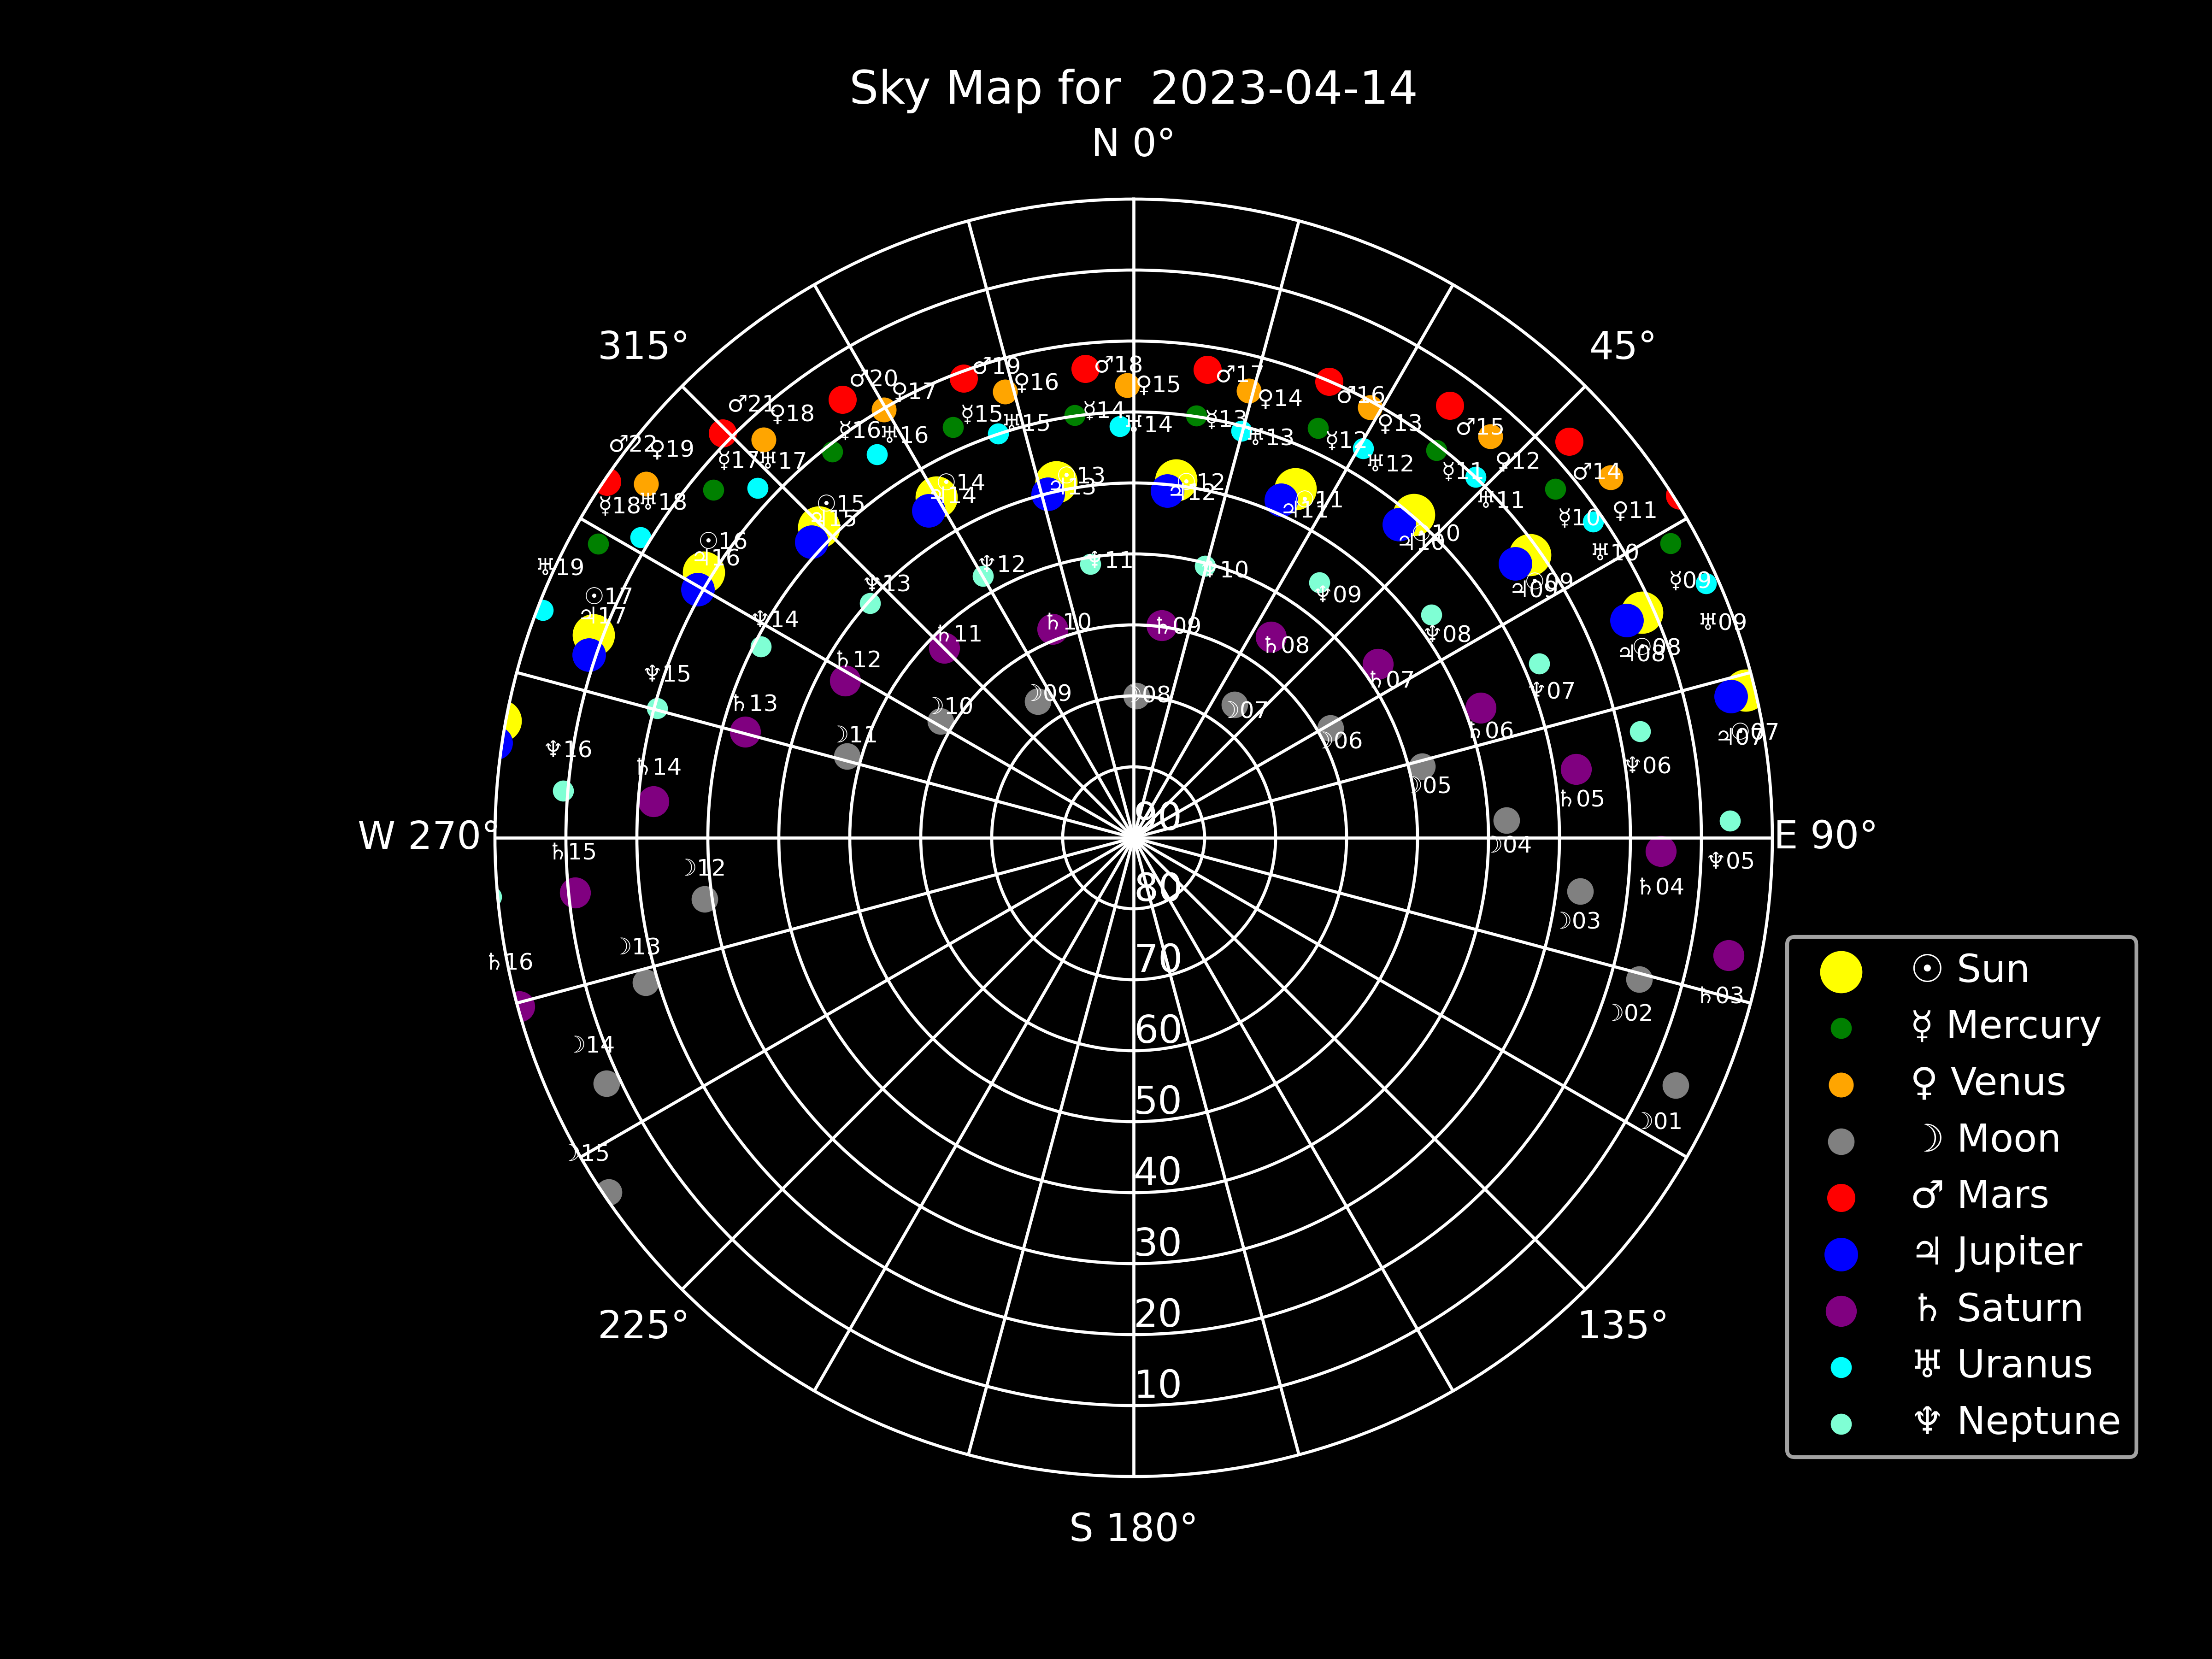
After earlier video on process creating Epheremis I wanted to do a sky map that would show the positions of the planets so that it was easily visualised, so I used the astroplan library and created a plot and after earlier only plotting one row of data from my Epheremis CSV I ended up plotting
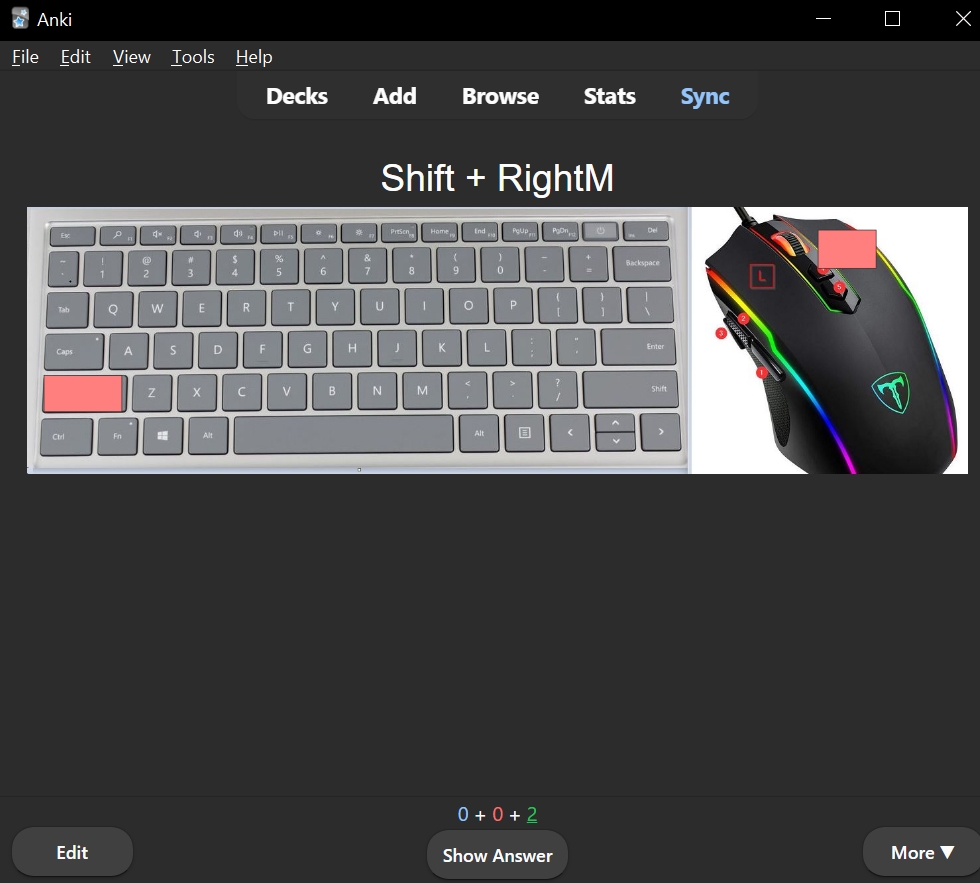
I was looking at a vid on 200 AI tools and they mentioned ANKI for flashcards so I went and looked up the tool. I was pretty impressed with it and decided I had a use case for it for learning AutoHotKey Hot Key shortcuts. So I had to build a deck with all of
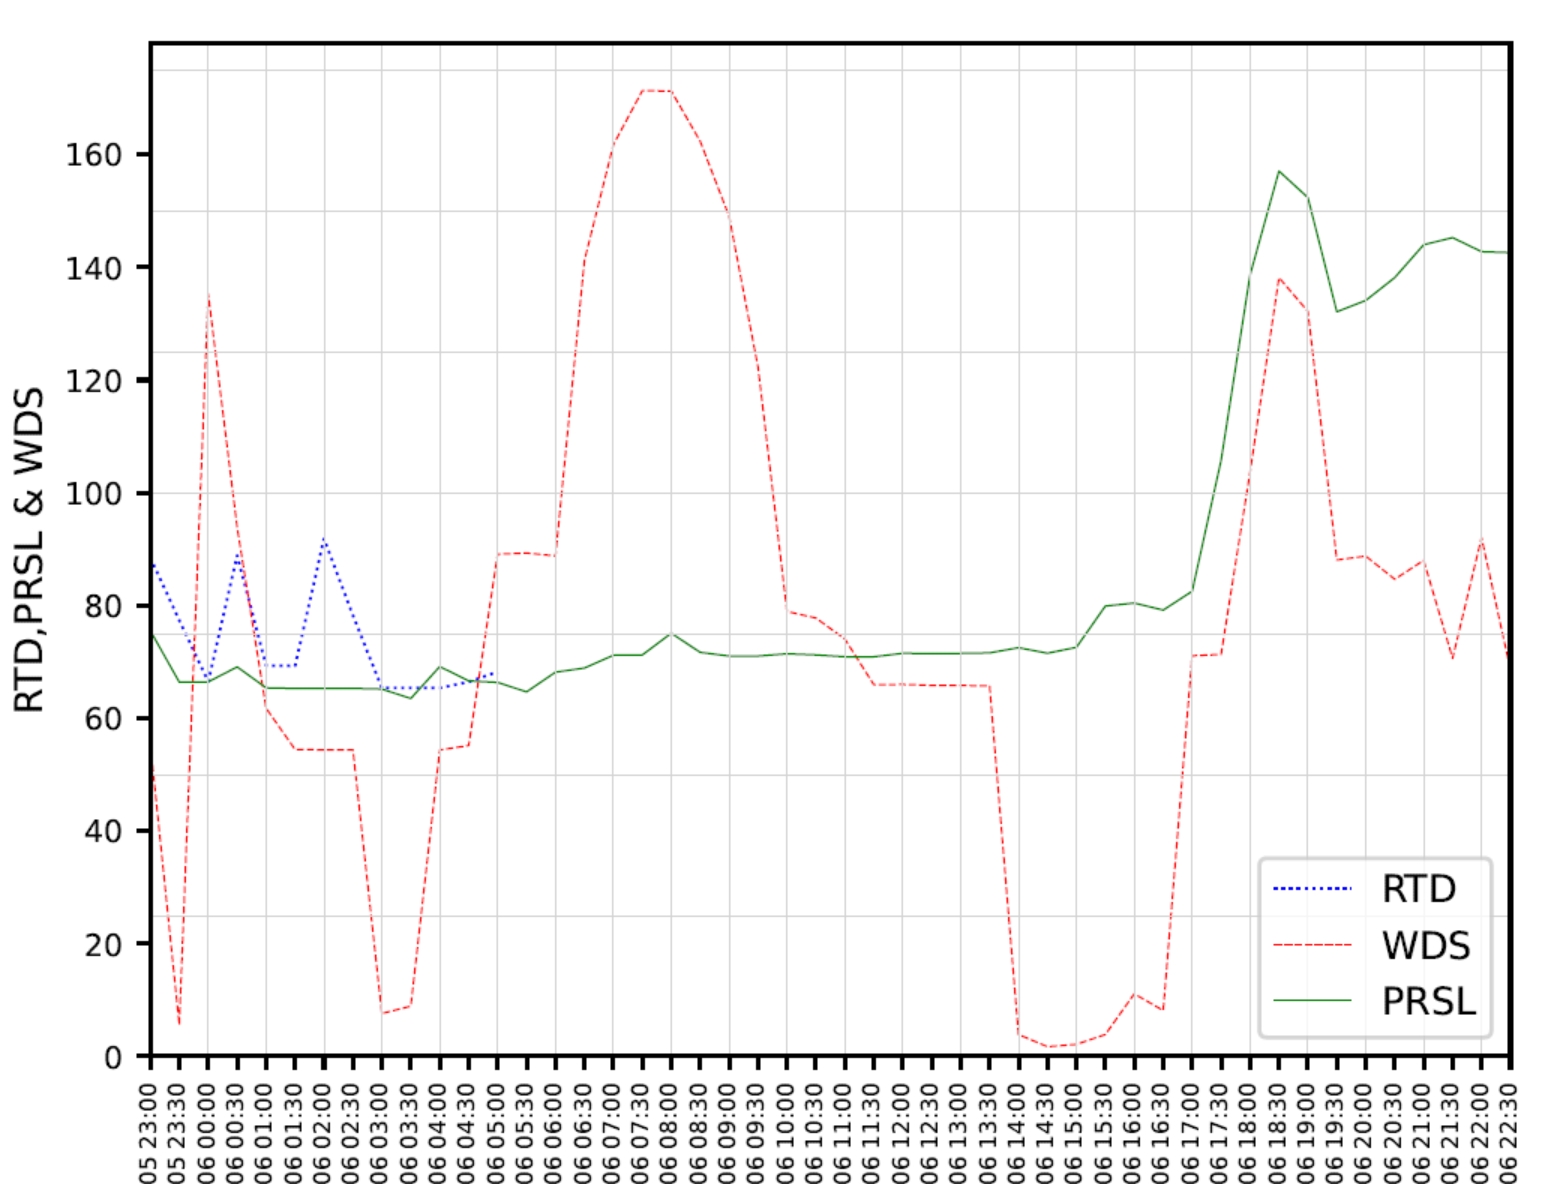
There is a WITS dashboard (Wholesale Information Trading System (WITS) is the gateway to the New Zealand electricity market) where you can view WDS (Weekly Dispatch Schedule), PRS (Price Responsive Schedule) and RDT (Real Time Dispatch). So WDS is weekly guess at demand, PRS is what Buyers are predicting it will do and are paying
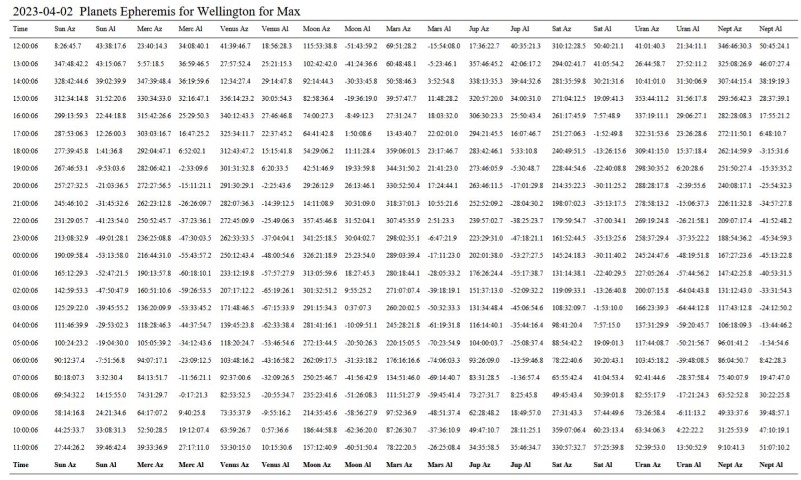
After creating a visualisation of planets orbiting in the solar system I wanted to see if I could create a daily Epheremis of planetary bodies for my particular location with Altitude & Azimuth locations at hourly intervals and then send it to myself via an email so that I could access it on my mobile