Python Future prices, WITS API & My Electricity Bill
There is a WITS dashboard (Wholesale Information Trading System (WITS) is the gateway to the New Zealand electricity market) where you can view WDS (Weekly Dispatch Schedule), PRS (Price Responsive Schedule) and RDT (Real Time Dispatch). So WDS is weekly guess at demand, PRS is what Buyers are predicting it will do and are paying for Future demand and RDT is what actually happened.
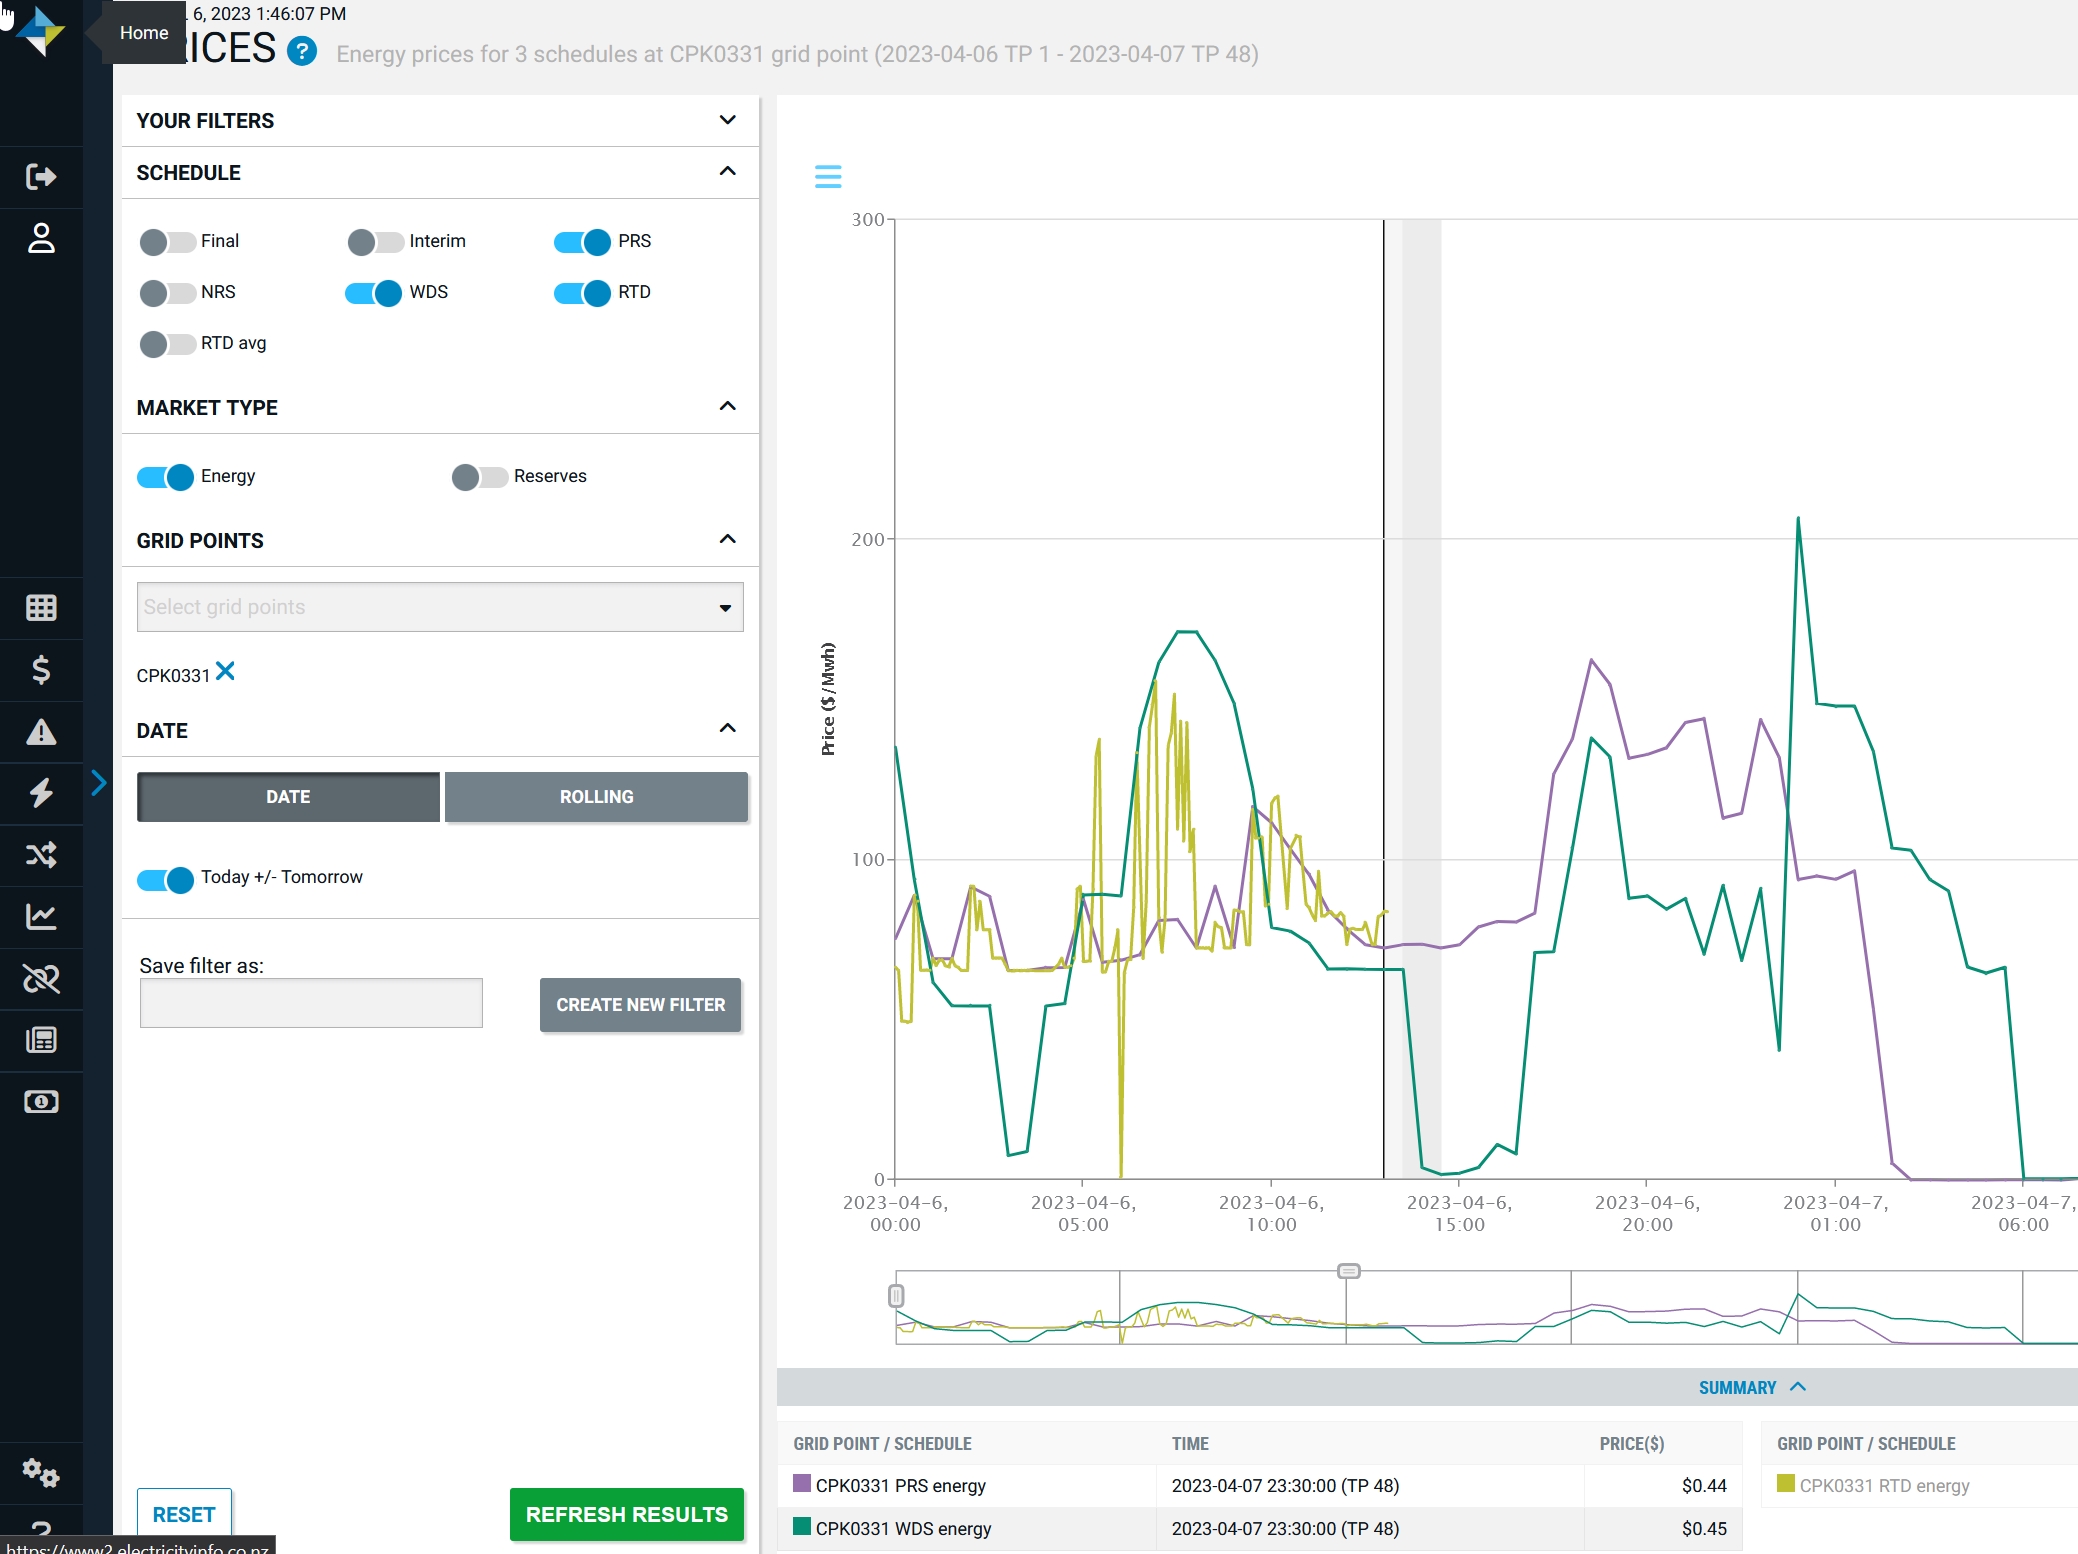
You can sign up and instead of getting the Main Line, like Hay2201 in Wellington you can get the local substation, which is Central Park 0331 for me.
You can also sign up for the WITS API. I did this and followed the instructions for setup but was waiting for a while for an email to activate the Energy API to allow developers to get the Bearer Token required for automating the API calls.
You can use their Catalogue to test the cals and at the beginning you have to add your API credentials (Client_ID and Client_secret) and it generates the Bearer token which is valid for 2 hours.
I finally emailed the provider and found that it did it automatically and I’d got my code wrong. So after altering the code and being able to get the Bearer token via an API call I was set to create scripts to return JSON data about the daily activity of the market.
I wanted to be able to email myself a shot of the daily activities so that I could see when there was likely to be a high demand and that would allow me to see I I could adjust my electricity use so that I could try and keep my bill lower.
The Process
The following steps:
- Make API call to get Bearer Token
- Use token to make API call for the following:
- WDS at CPK0331 and get JSON data for a 24 hour period
- PRSL at CPK0331 and get JSON data for a 24 hour period (PRSS only gives shorter forward prices than the 24 hours , about 6 I think)
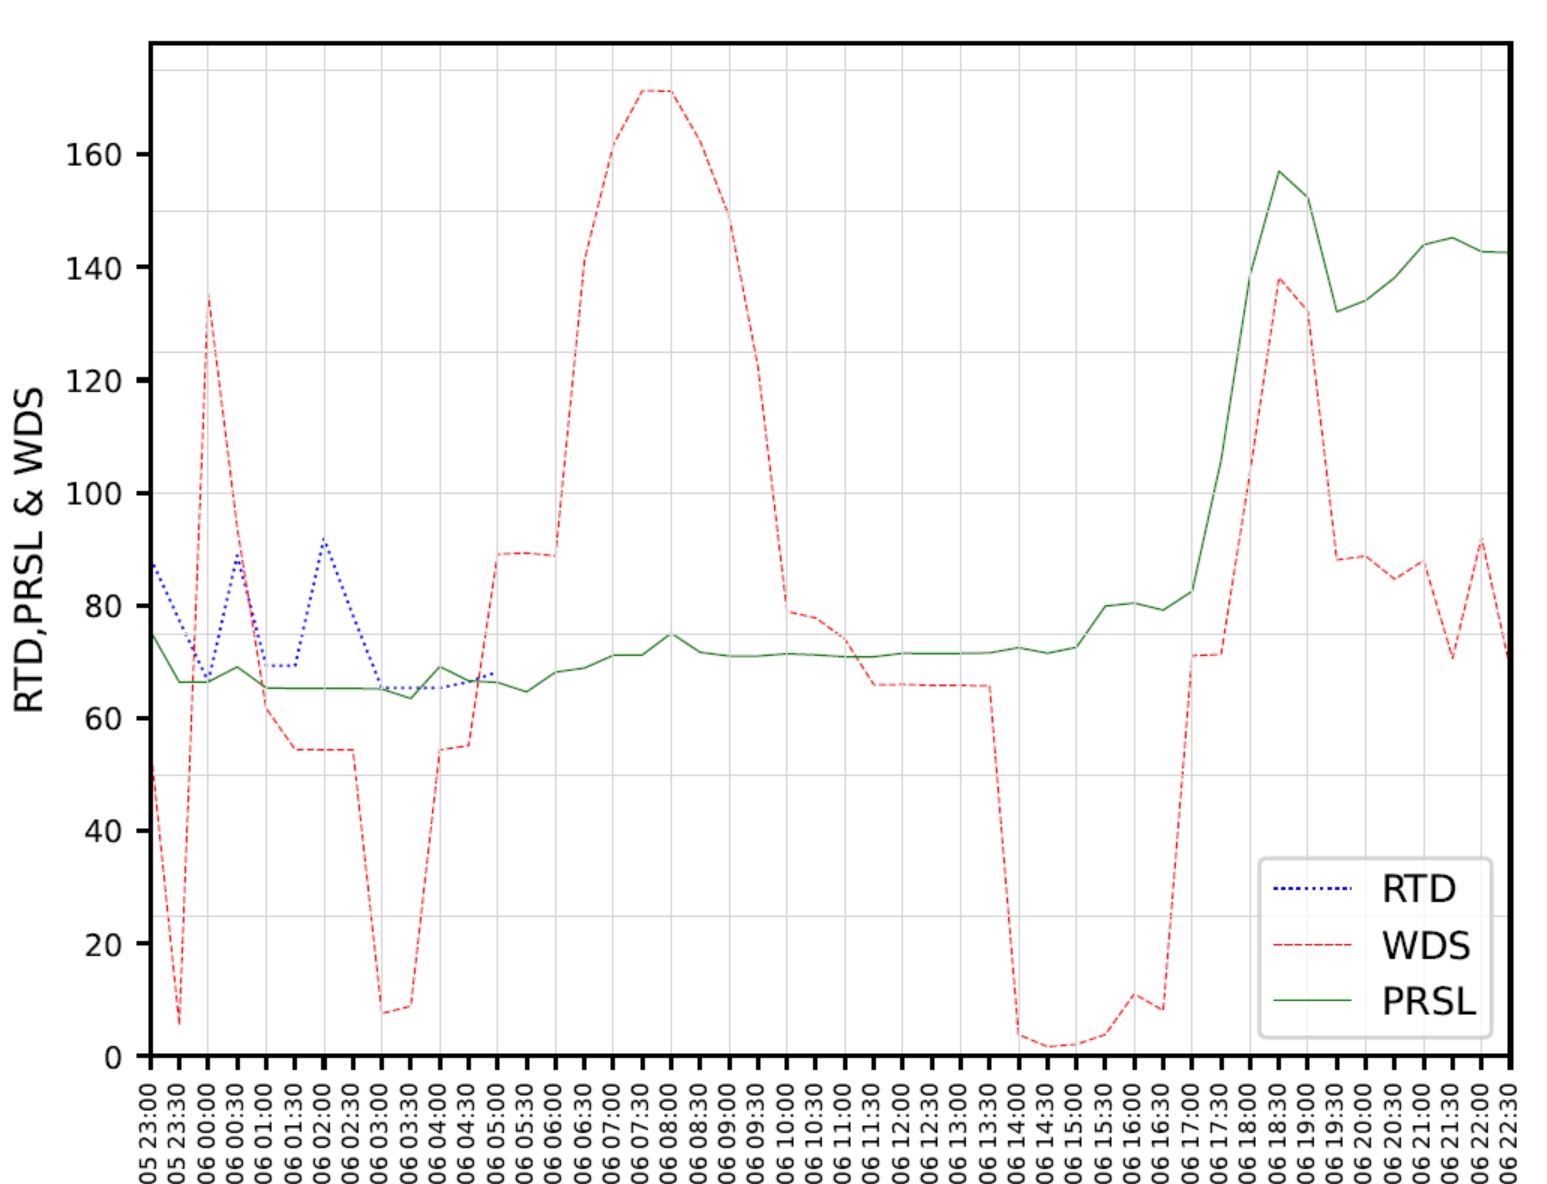
- RTD at CPK0331 and get JSON data from 11pm the previous night to 5am today. So when I wake I can check trends of seeing if REAL TIME pricing tracking PRS pricing
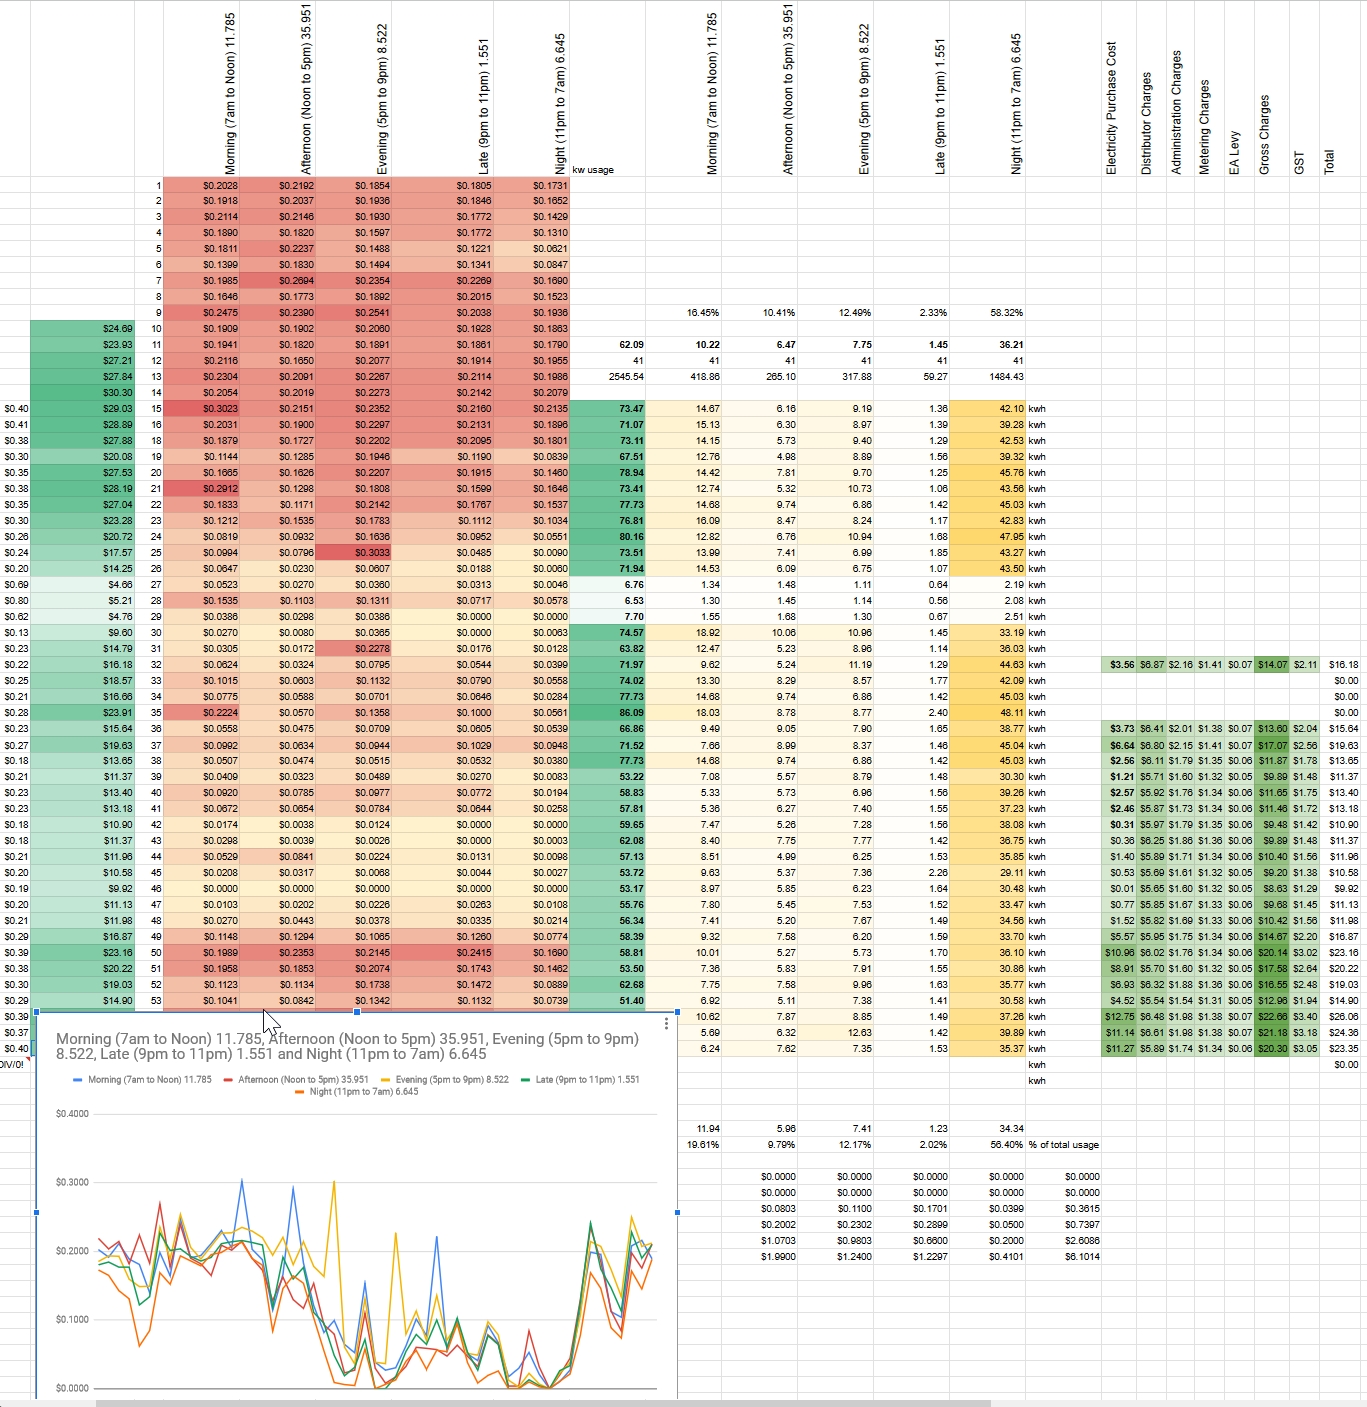
Once I have these JSON files I can convert them into Python Panda DataFrames and Join them all into a single CSV for the period, using the Datetime as the index to the Dataframe and export it to a CSV file.
I can then create a Plot of the data, and from the plot, convert it to a PDF and email thee PDF to myself daily as an attachment in the morning.
So, I have now got the data adjusted for a daily email to give indications of predicted pricing for the rest of the day and to indicate what the real Time price was overnight when I was running water heater.
Bing Chat & Plot
I used Bing Chat to add lots of different features to the plot, like line type, line thickness, legend, increments on X and Y axes and background grids. I found for these extra additions to the base plot were altered very quickly with Bing Chat. It would have taken me a whole lot longer if I was to try and do it without the AI assistance.
At this point, I have the scripts, I just have not set them up to automate daily yet.
Matplotlib plot to PDF
I wanted to create a plot and then export it to PDF as part of my process for developing a Map for the Epheremis I’m doing for planetary orbits. So, in itself, not a key component for this particular exercise but the learning will help me in one of my future projects.
End comment
I’m pleased how this went, I will set it up to automate daily so I have the information available. I may have to add more information to the data, such as shaded regions at peak times so I can easily see when its more expensive to use power.
Working with the AI Bing Chat is BECOMING easier and I’m getting more information from it more quickly.
I find posting part of the code I HAVE and describing what I want to do helps to train the model on what I want and how I want it written.
I find if its something common (like adding features to a chart) it adds value very quickly.
If on the other hand you ask it which chart is best, it doesn’t do so well. So as an additive process to something you’ve already setup and is running, it works well. But for original selection not so much.
Its still early days for me using it but I’m starting to get a feel for where I can use it productively to speed up my coding.
For the epheremis I haven’t chosen a Plot type yet, but when I do I hope to use BING chat to enhance it and also to process it so it creates a PDF file. I would like to see if python can merge 2 different pdf files, that WILL be the step following the creation of the epheremis plot.