Python create Daily Planets Sky Map for Epheremis, Email & Automate
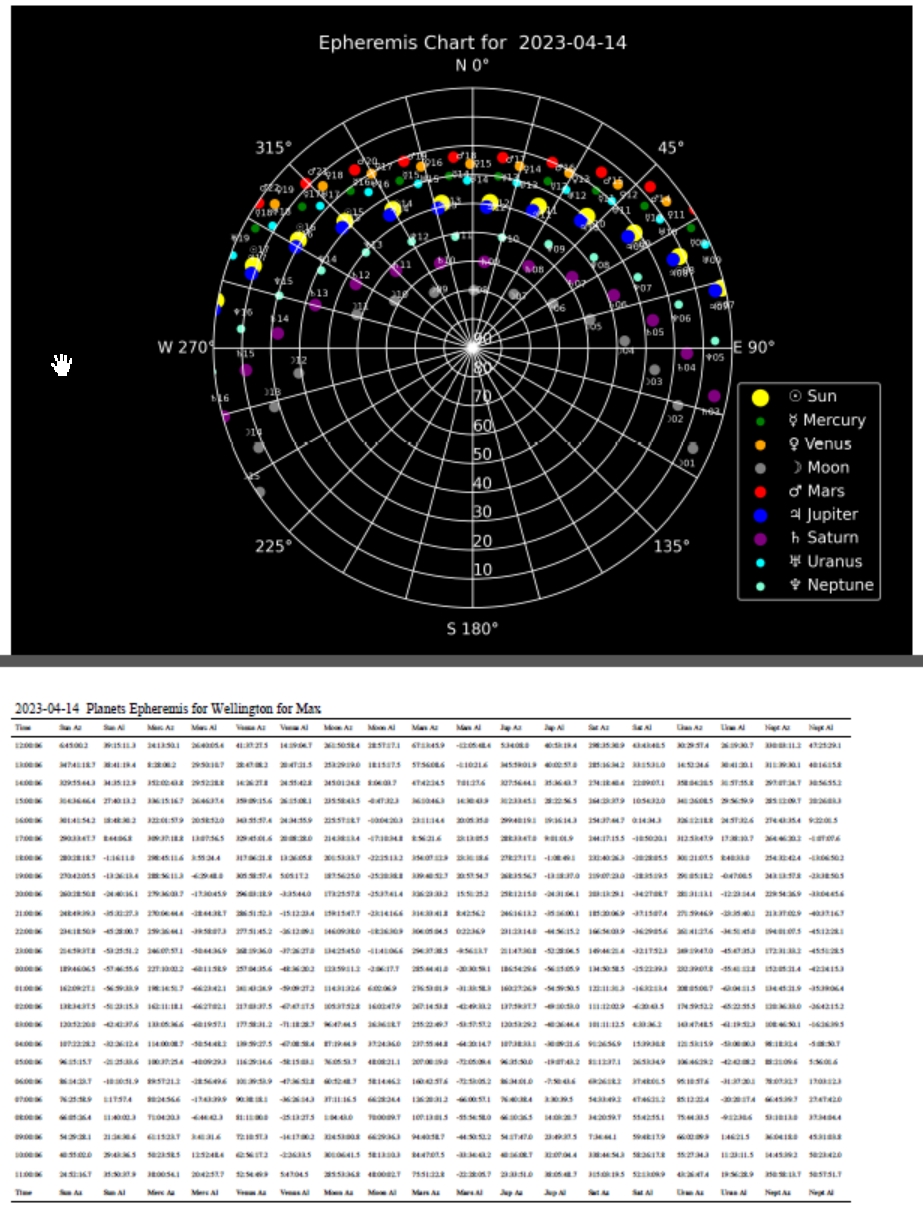
After earlier video on process creating Epheremis I wanted to do a sky map that would show the positions of the planets so that it was easily visualised, so I used the astroplan library and created a plot and after earlier only plotting one row of data from my Epheremis CSV I ended up plotting all the planets at hourly intervals on one plot.
After creating the plot I saved it to PNG then converted it to a PDF and then merged the original Epheremis table PDF with the SkyMap PDF .
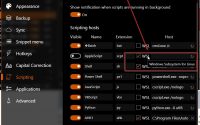
I then adjusted the triggers on the existing task Scheduler processes of:
- Creating The Epheremis with script, triggered at 12pm (midday)
- Added a new process for the Skyplot to start after Epheremis process finished
- Moved Emailing Epheremis to myself via email to a later trigger time and selecting the combined PDF instead of the original Epheremis PDF only.
I found Bing Crosby (Bing Chat AI) very useful in adding and altering the script to add details when I got errors. In fact , I sat at the PC for 2 1/2 hours as Bing Crosby fixed code to make it work to my requirements. Overall I find using Bing Crosby really useful for solving issues far more quickly than me debugging and googling solutions. The coding knowledge is still required as it helps to foes on the errors and identify the issue so you can steer the AI to methods that you can realistically expect a solution.
Refer video for code uploads and other information.
Project process
Overall the project went quite smoothly and I was pleased with the results to date.
There are refinements that can be added to enhance the final product such as:
- Using AU (Astronomical Units ) and planet diameter sizes to give realistic relative sizes for planets, moon & sun.
- offset text in a manner to allow further clarity on the plot and look at alternating offsets (to left for one and right for others X = +/- offsets
- Adjusting the background grid by graying out and thinning lines
- increase pixel of .PNG image file
- See if plot can draw grids first with planets on top , rather than the other way around.
End comment
The follow on from this is adding extra data for the process and other embellishments such as :
- logo for the epheremis , if you are doing for others then having a logo with personal information may be useful. I did try using bing Cosby Image creator for logo but found it pretty poor. Maybe it needs training by showing it things that you like
- The logo challenge drove me to explore how to overlay information onto a PDf and that will be a topic of another article
- Hyperlinks would be good, if you look at say, the sun , and want more data about it, in the emailed PDF you could have links to other pages to give fundamental information, such as NASA planet data.
- I started thinking about what other information I’d want, such as moon phases and sunrise/Sunset times, another epheremis type setup with a table that could be generated for the month forward on a daily basis.
Overall I’m very happy about how the project progressed and the workflows to get the information out. Its not necessarily the best information but the process is robust. So that is pleasing. It was also nice that the setup that I had was easily changed to incorporate the skymap into the process.
I’m finding Bing Crosby (aka Bing Chat) is great for accelerating my proof of concept ideas from a basic intent into practical code. I’m also getting familiar with how to get restarted when it starts looping into fixed patterns.