Visual Asset Strategic Tools. Capture Building Information for Building Life Management. Open Source/Low Cost Technology Solutions for you to control your buildings
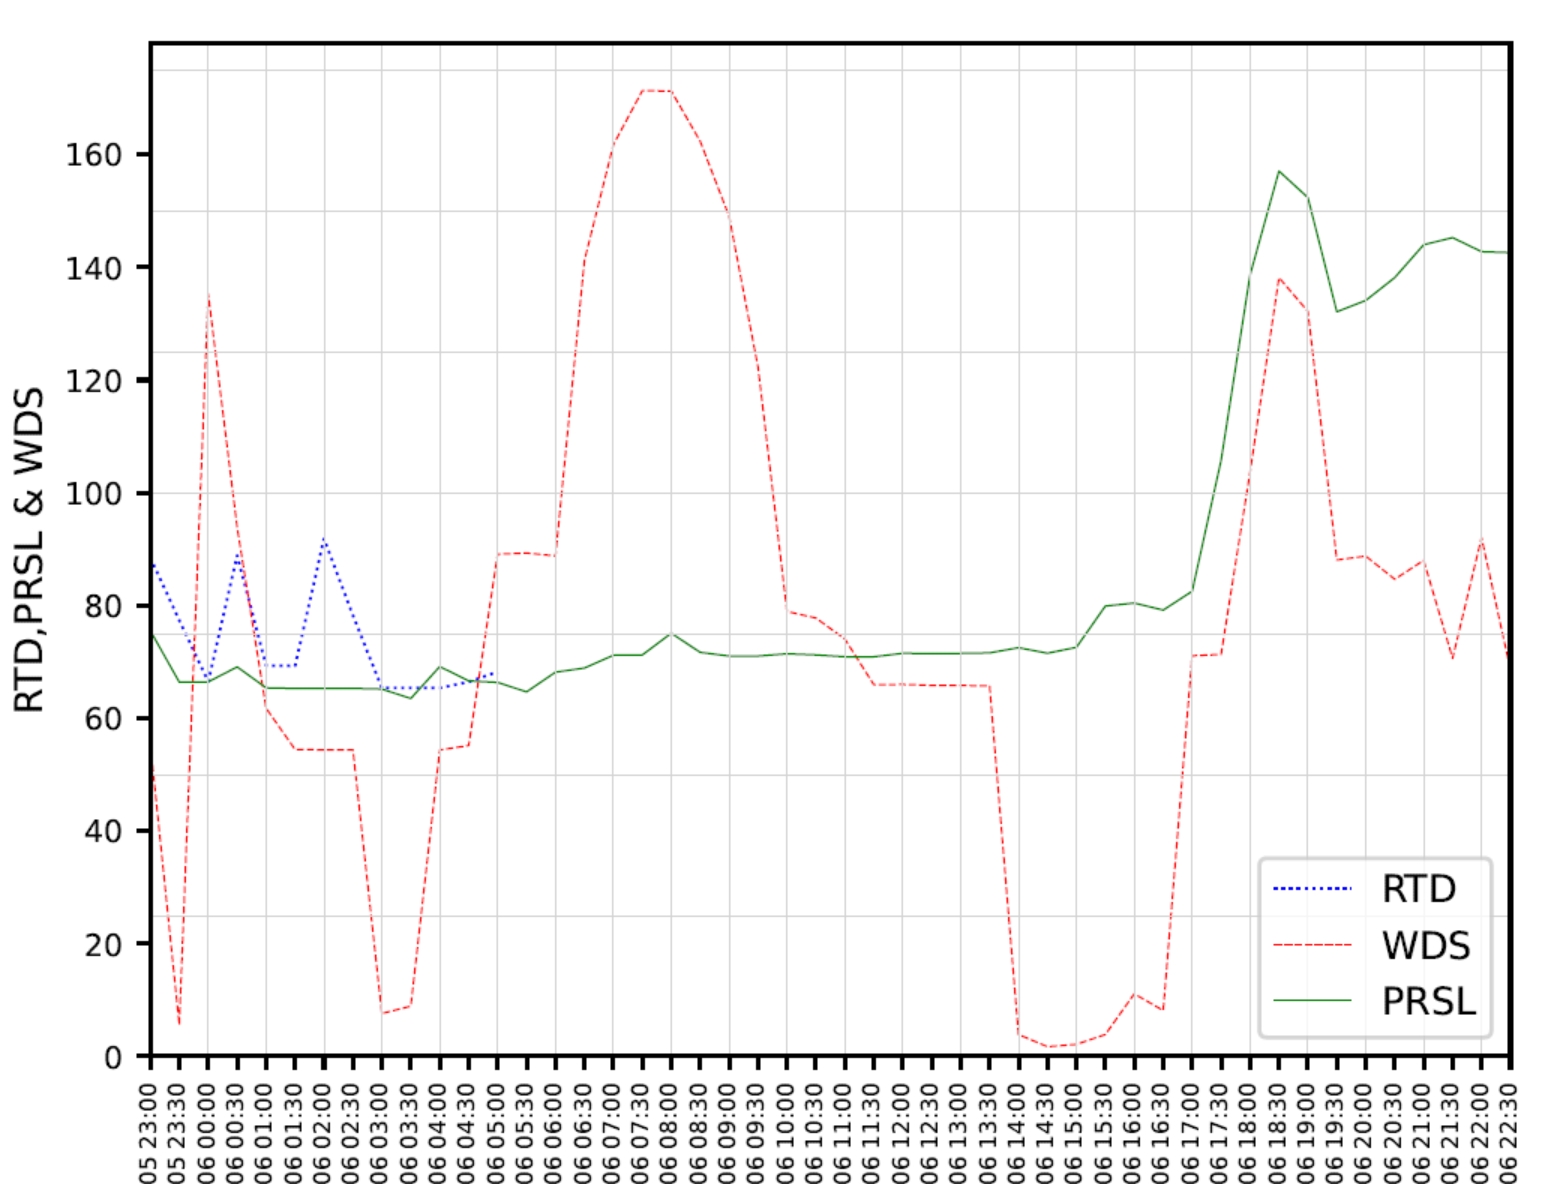
There is a WITS dashboard (Wholesale Information Trading System (WITS) is the gateway to the New Zealand electricity market) where you can view WDS (Weekly Dispatch Schedule), PRS (Price Responsive Schedule) and RDT (Real Time Dispatch). So WDS is weekly guess at demand, PRS is what Buyers are predicting it will do and are paying
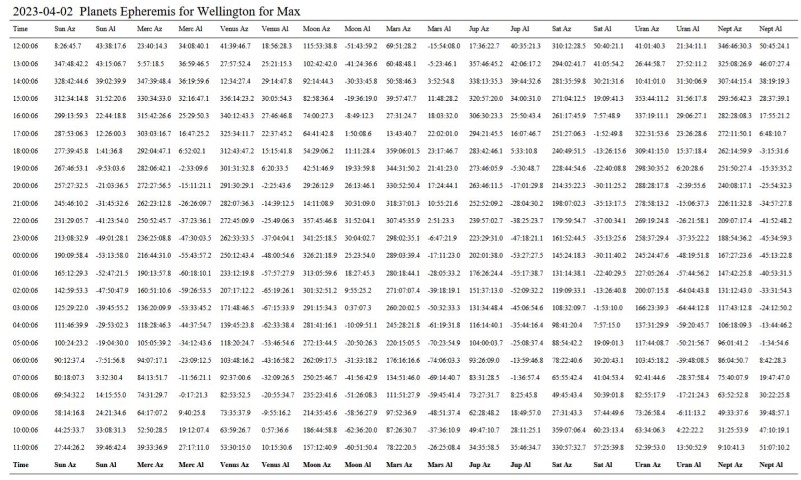
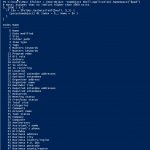
After creating a visualisation of planets orbiting in the solar system I wanted to see if I could create a daily Epheremis of planetary bodies for my particular location with Altitude & Azimuth locations at hourly intervals and then send it to myself via an email so that I could access it on my mobile
I was looking up free productivity tools and came across the following video, unfortunately I’ll have to type out the code myself as there is no link for the code. This Looking at YouTube there was another video, and rather than just text expanding, it allows you to execute something, like a function or script
I’ve been following the growth and interest in chatGPT and its use. I’ve used it successfully for some simple coding and its giving me mixed results, but usually helps me find a way forward to the solution I’m trying to achieve, even if the code is wrong by offering alternative ways of doing things (eg
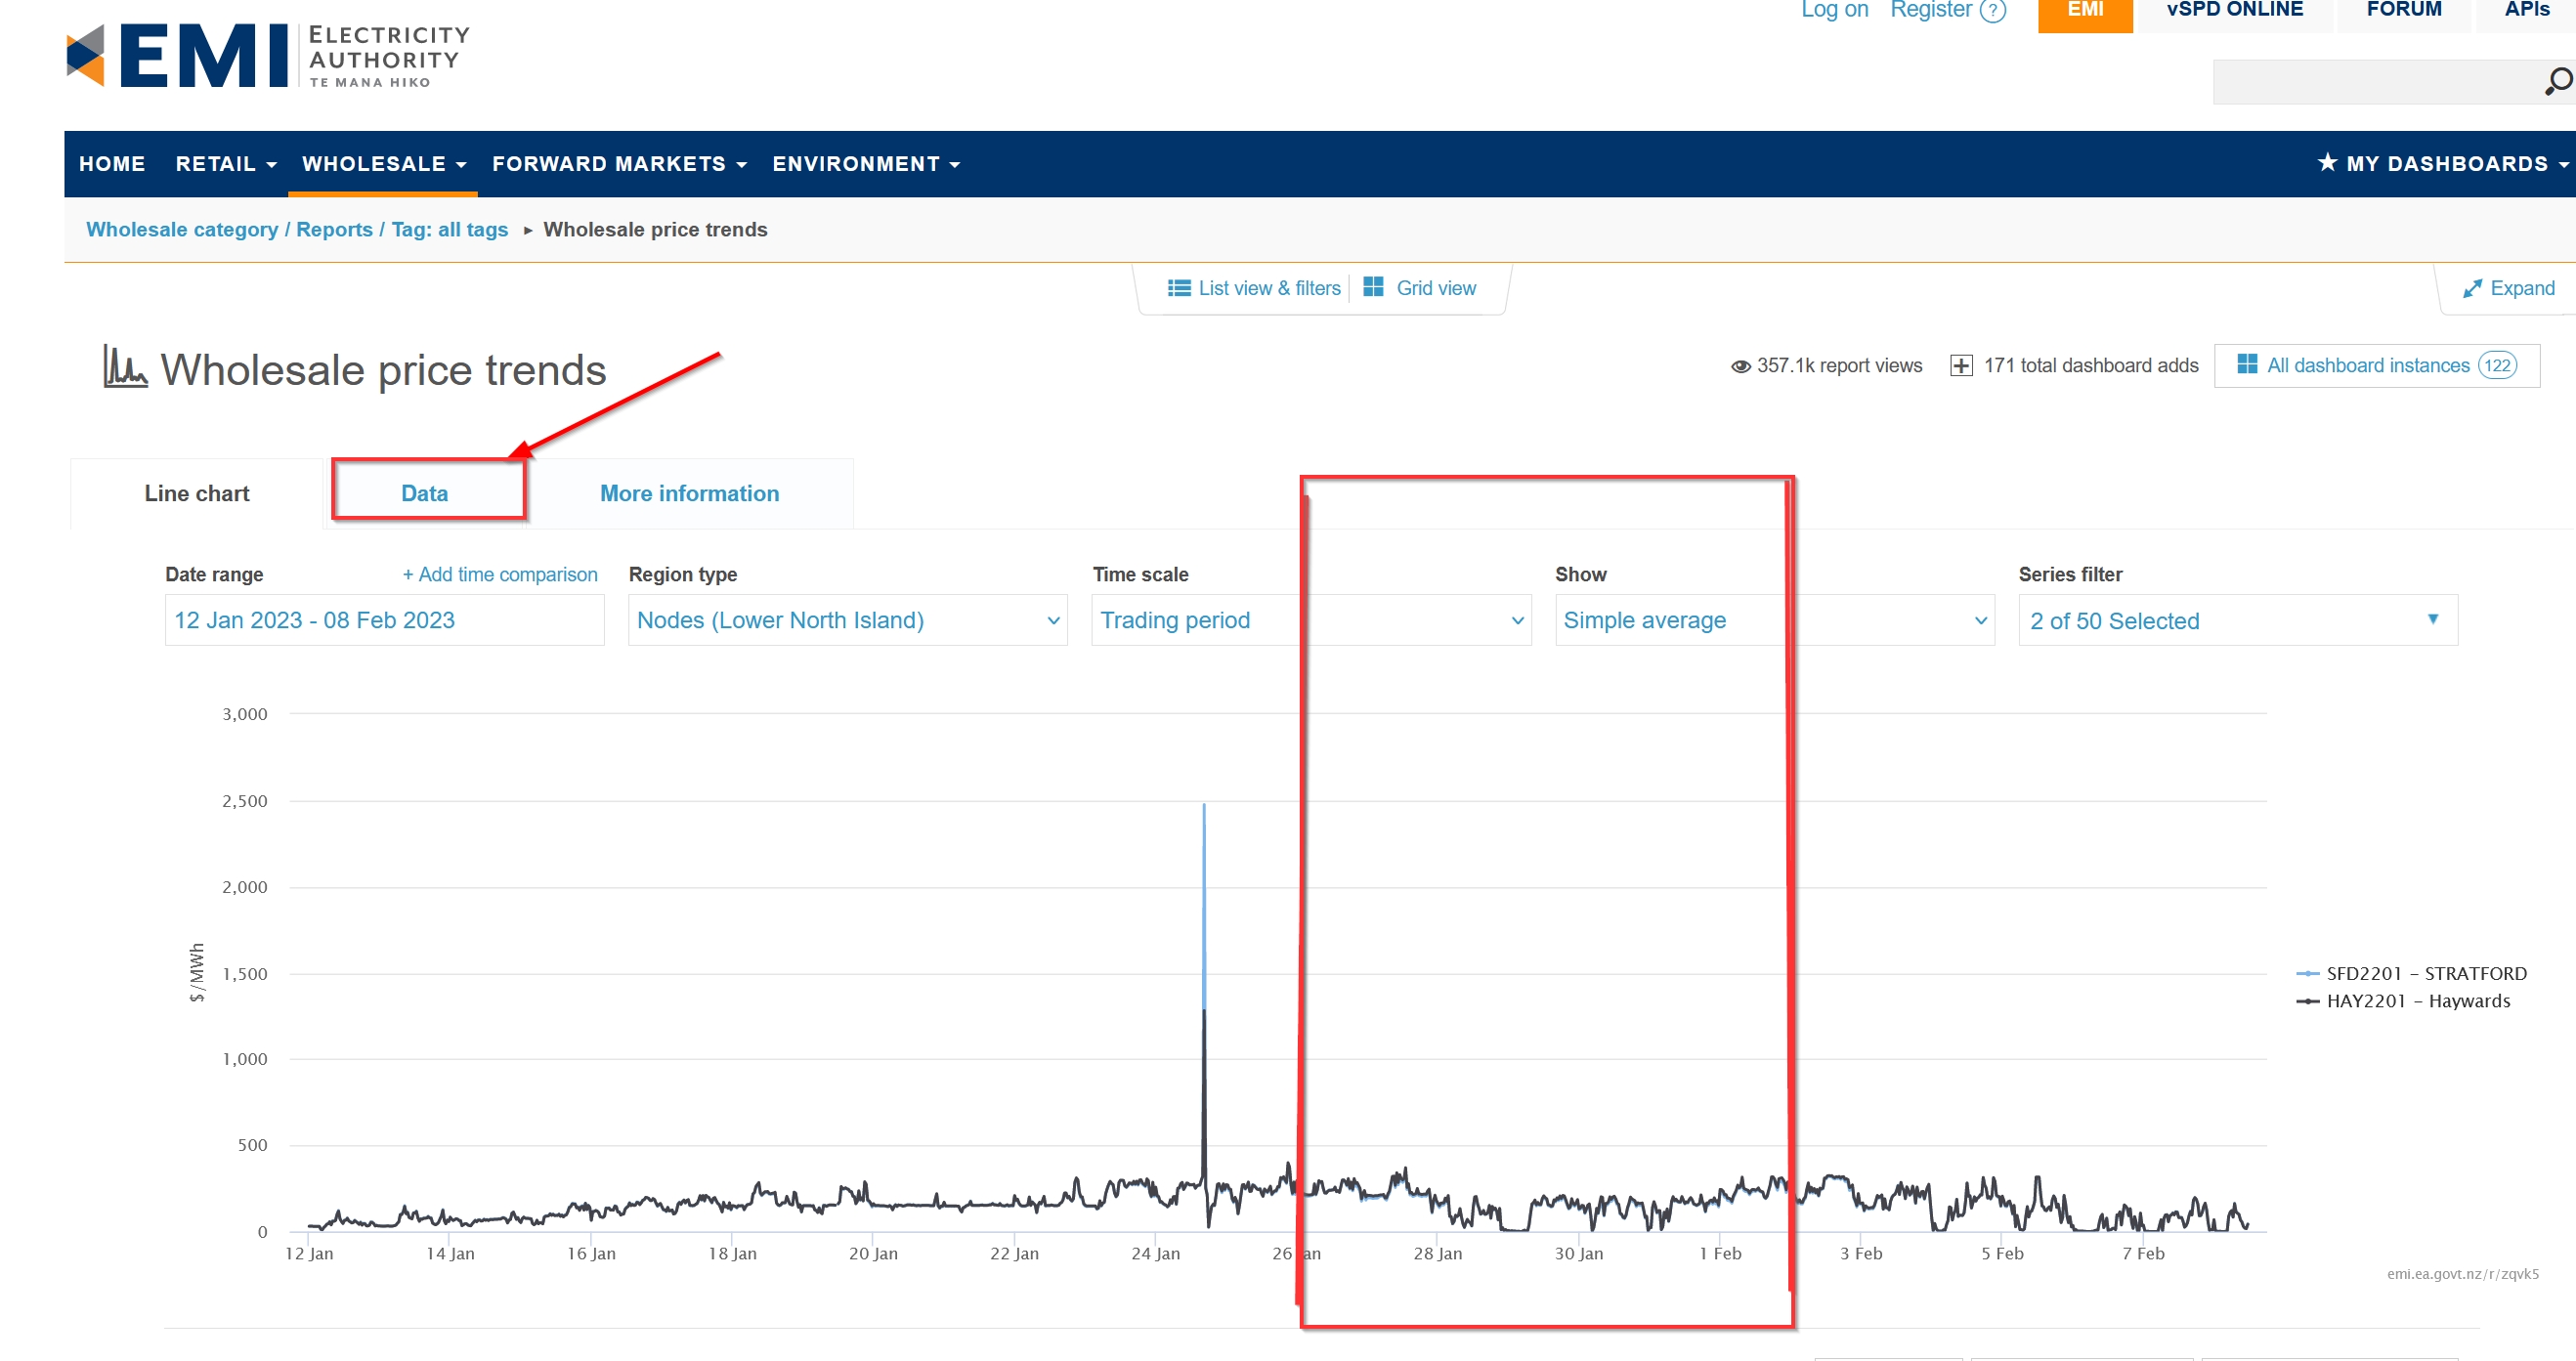
I pay my electricity bill weekly, its based on wholesale spot pricing, so can change quite a lot, quite quickly. I’m not quite sure what the underlying factors are that make it change so dramatically and the Electricity bill is not of much help. I sometimes look on the Electric Authority Website for wholesale prices
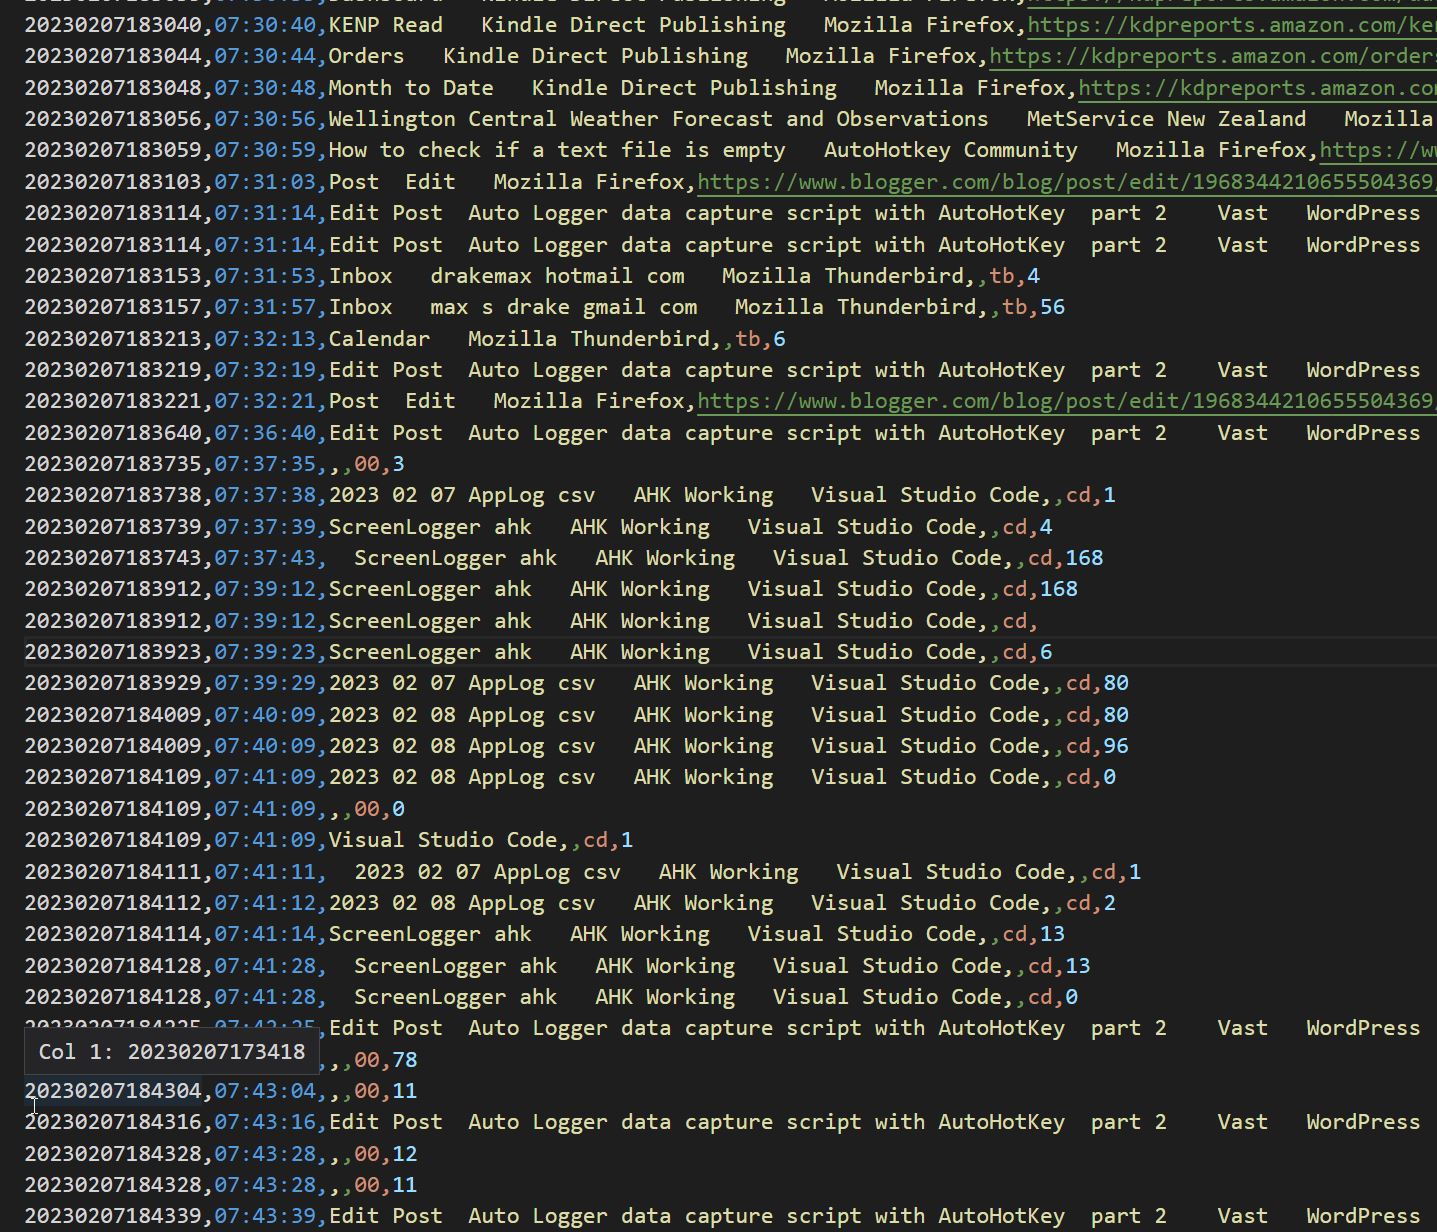
In Auto Logger and timesheet exploration with AutoHotKey and Python Part 1 I gave an overview of the project, in this article I want to go into the development of the background process of auto-logging computer activity on the PC. My initial start, as mentioned in the previous article was to start with the code
This is an overview of the project I’m undertaking trying to develop objectives and scope of the project. I made a YouTube Video on the topic which incorporates the first part of the project to date. In this article I’ll just do the overview and in the next article I’ll go into the logger script
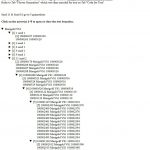
The web page for the Tree Diagram Background story My daughter is a grower and she had information on the different generations of plants she is growing. She has a spreadsheet that she uses to show different strains of plants, grown initially from seed and then cloning the plants to get the best strains. To
I’ve been working on a project that has been going on for years, I’m picking up aspects of the project and doing some work on them and then leaving them for a while. I’ve had issues with finding the relevant documents later as I’m dipping in and out of the folders and moving things around,
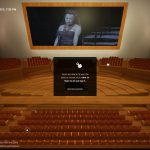
I thought this was cool. VRSEAT for choosing Theatre seats. This is a cool extension on what I was playing with in Revit and 3d package, to show view from a specific seat, I’d used the ASB basketball centre on the waterfront for my example. My only comment is that you don’t see the seat