Visual Asset Strategic Tools. Capture Building Information for Building Life Management. Open Source/Low Cost Technology Solutions for you to control your buildings
In exploring the data analytics tools (Knime, Rapid Miner, FME, Orange..) there has been references to WEKA. Weka is a collection of machine learning algorithms for data mining tasks. The algorithms can either be applied directly to a dataset or called from your own Java code. Weka contains tools for data pre-processing, classification, regression,
It provides a wealth of functionality to speed & optimize data exploration, blending & cleansing tasks – reducing the time spent importing and wrangling your data. RapidMiner provides an integrated environment for data preparation, machine learning, deep learning, text mining, and predictive analytics. RapidMiner Studio (Some information see item 18 of list). This programme keeps
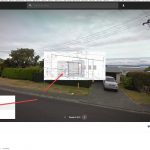
Create a tour Use Google Tour Creator to create and publish virtual reality tours. You can use Google Street View panoramas, add your own images from 360 cameras, and annotate the tour with details and facts, to create immersive experiences. Help information here. You need to have a google account to have tours. Refer help
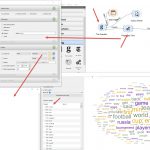
A few words of jargon in the Text Mining area. Corpus. In linguistics, a corpus or text corpus is a large and structured set of texts. They are used to do statistical analysis and hypothesis testing, checking occurrences or validating linguistic rules within a specific language territory. Token. Tokenization is the process of demarcating and
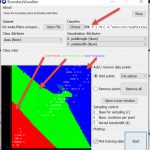
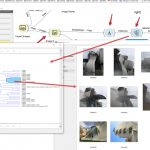
I watched this Orange Tutorial and thought I’d like to give it a try. The Image Embedder goes back and processes the images based on an online database. It then adds more features to your initial data. The Image Analytics Tab is an ADD-ON. This was initially blocked and I had to run Orange in
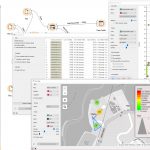
Linking If you look at the video on linking (bottom left video link) you can see how assets can be linked together. I wondered whether this could be a useful tool for linking lots of assets together, say, for a room. You can do this linking process within the browser, selecting one asset at a
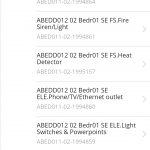
After writing the initial post which I wrote whilst setting up and populating the database I had a further play, using the Mobile App, or rather, I didn’t get very far at all. The company who set up the free Asset Management Site make Bar Code tags, so the accessing of data would be by
I was looking through 101-useful-websites article and came across AlternativeTo.net and used it to look up alternatives to say “Revit” and “AutoCad” and other tools I use. I then typed in KNIME which I use for data mining, data analysis and it came up with Orange as a free alternative. So I looked at some
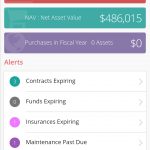
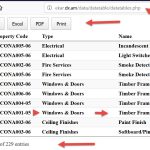
I have been interested in displaying tabulated data on a web page from a Database, exploring what is out there to use. WordPress has a couple of Free Table add-in’s but they are usually only available for uploading static data to your website (or from Excel/CSV). There is one WordPress Add-in that read from a
Panoramic files (360/180) can be viewed directly with a programme such as Paint, but they do not make much sense. You need a specific Panoramic programme to read the files correctly. I use the FREE photo sphere viewer by Jeremy Heleine. Follow the link to see the demos. The method that the programme uses is