Orange 2. Image Clustering
I watched this Orange Tutorial and thought I’d like to give it a try. The Image Embedder goes back and processes the images based on an online database. It then adds more features to your initial data.
The Image Analytics Tab is an ADD-ON. This was initially blocked and I had to run Orange in Administration Mode to access the downloads.
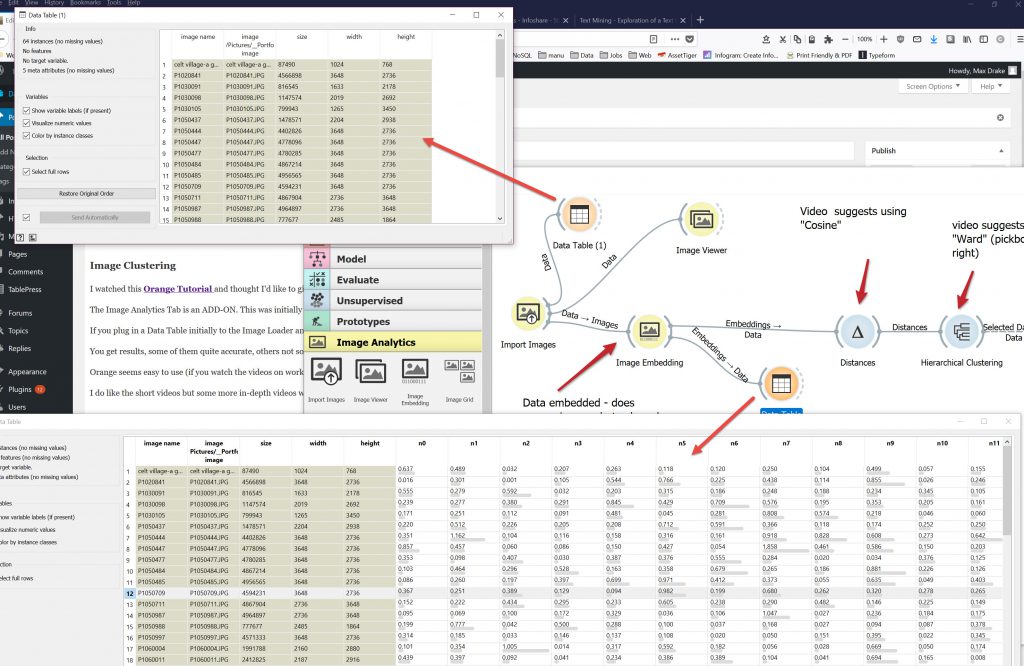
If you plug in a Data Table initially to the Image Loader and one after the Image Embedder you will see that a lot more columns with information have been added to each image (2047).
This workflow in Orange seems easy to use (if you watch the videos on workflows). You do get results. But very deep things are happening that are not too clear on the surface, so actually manipulating/altering the information is, currently, beyond my understanding.
Process
I selected a general folder of photographs, just to test the process
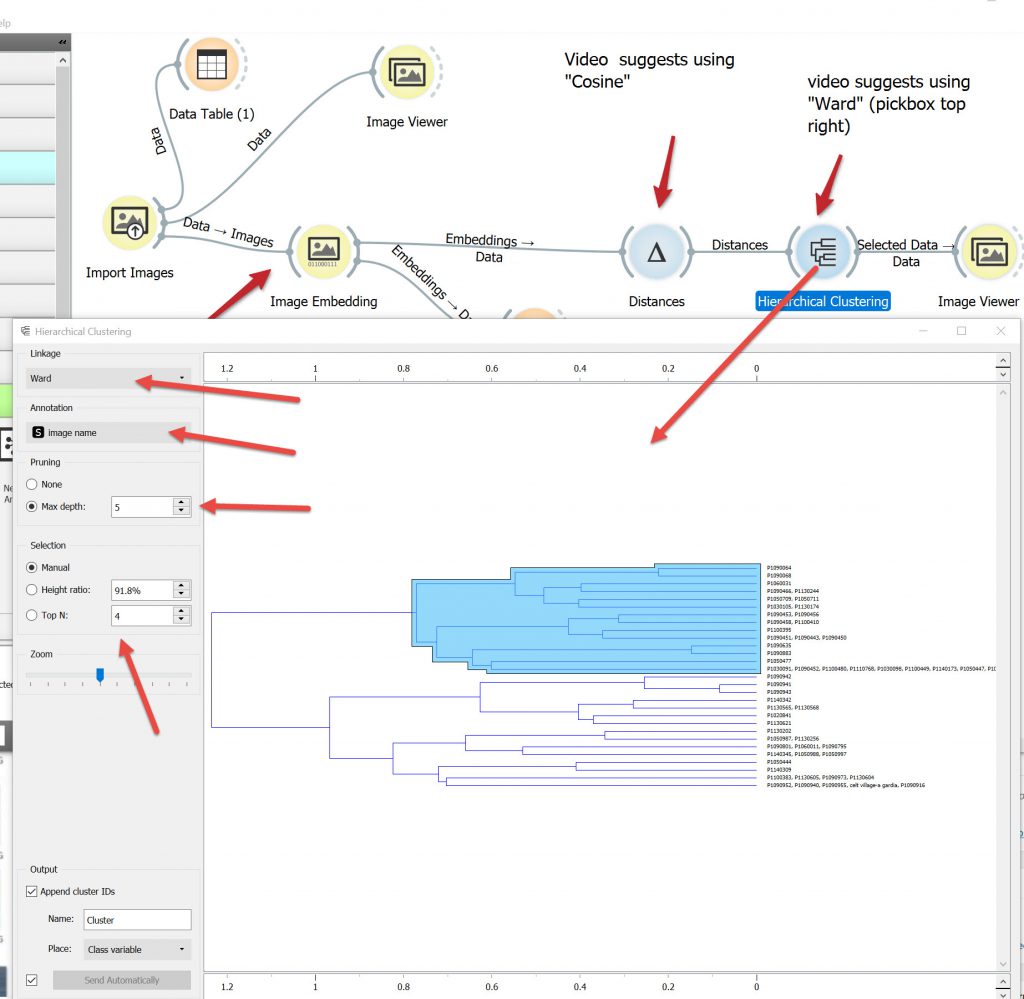
Orange setup was as per video
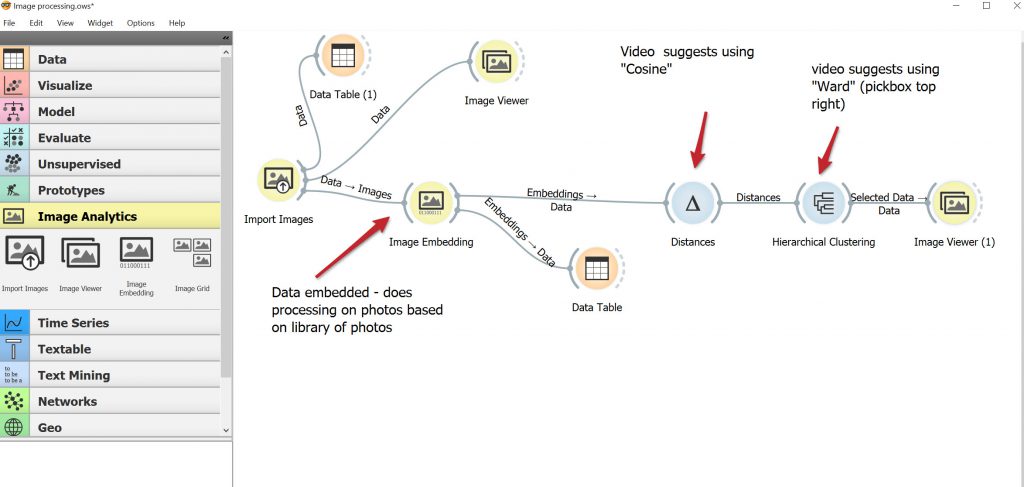
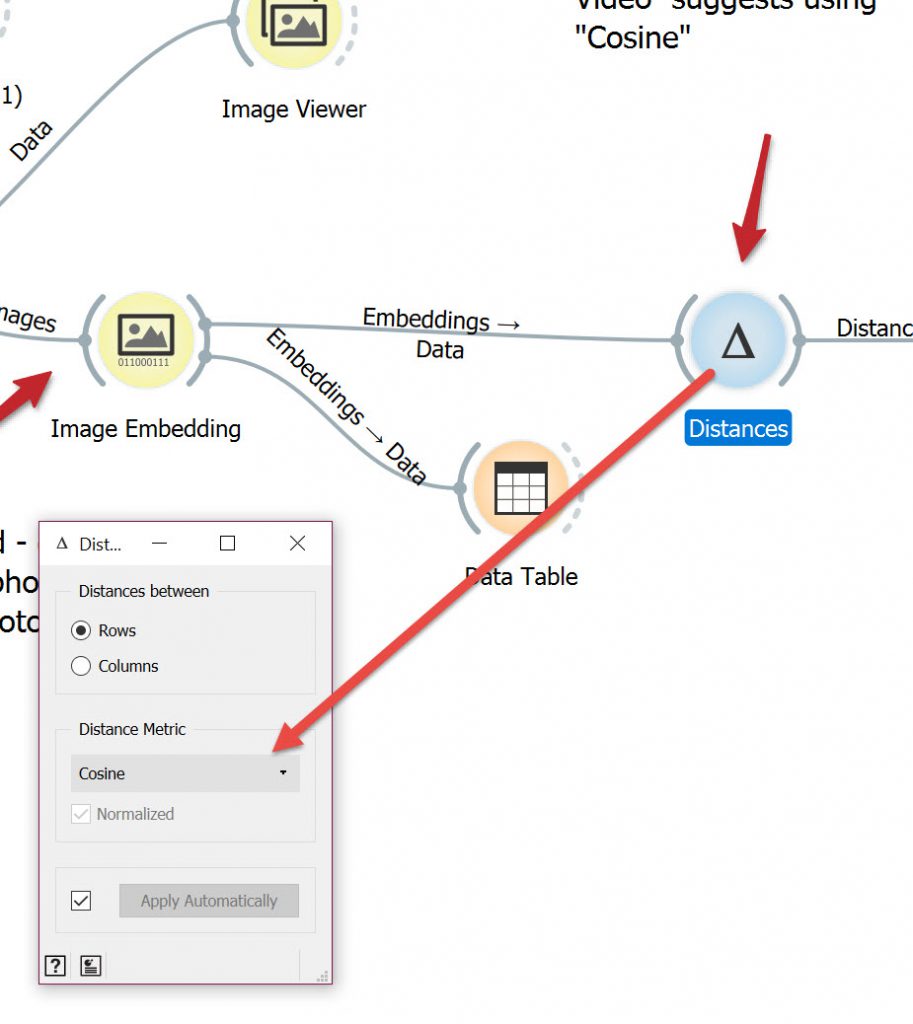
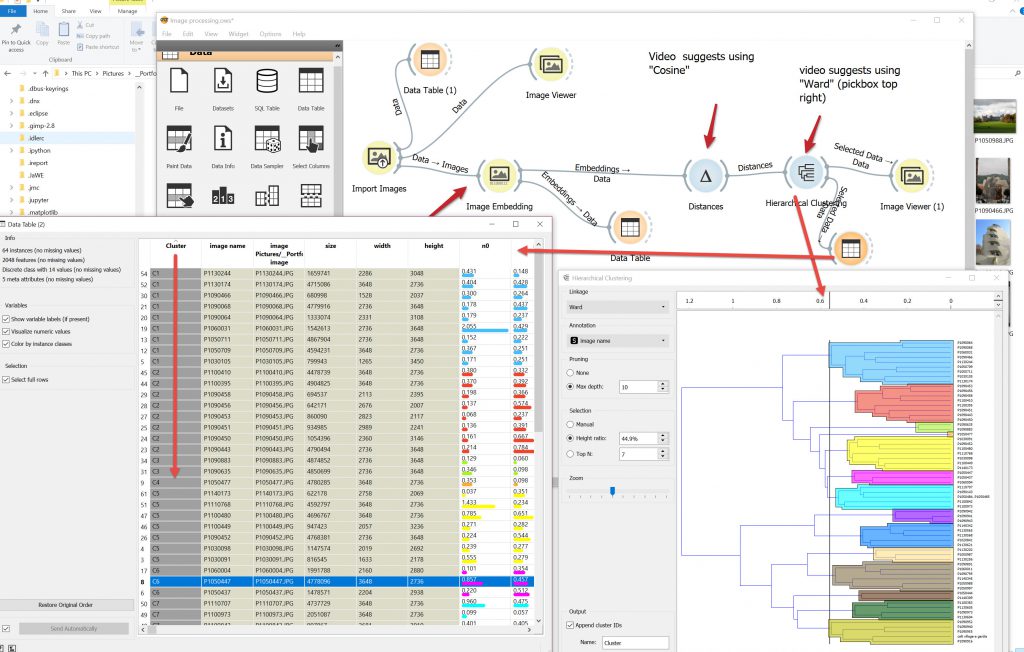
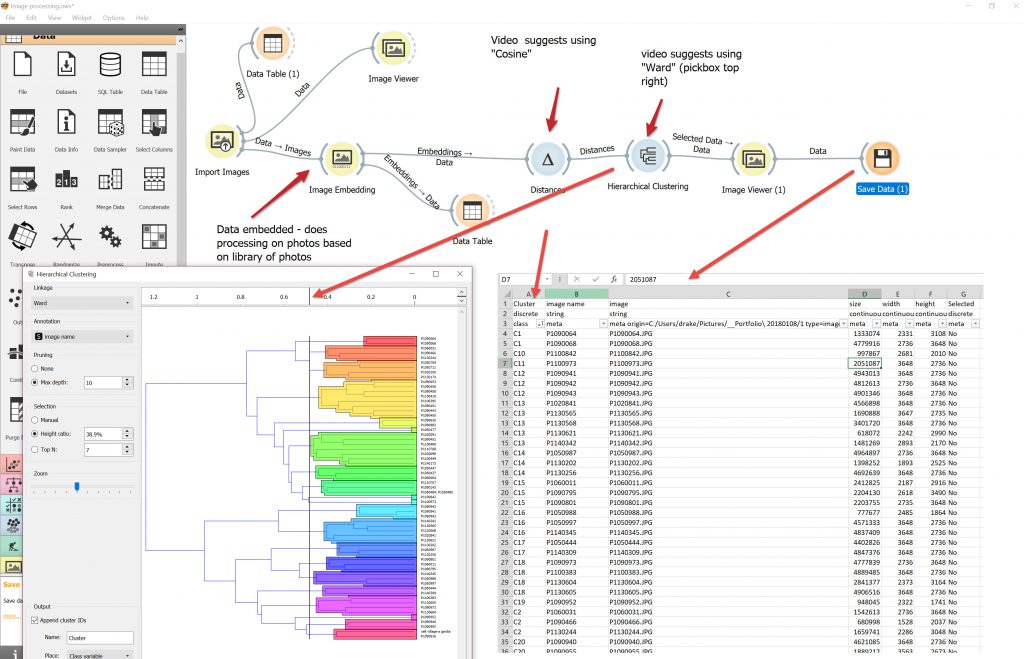
For Distances video advised “Cosine ” Process.
For Hierarchical Clustering Linkage “Ward”.
As part of the process, from the original file which has 5 column headers (see top data table on image below) , The Embedder creates another 2047 columns! (see bottom data table on image below). So it must be doing a lot of analysis in behind the scenes, and its not taking hours to generate.
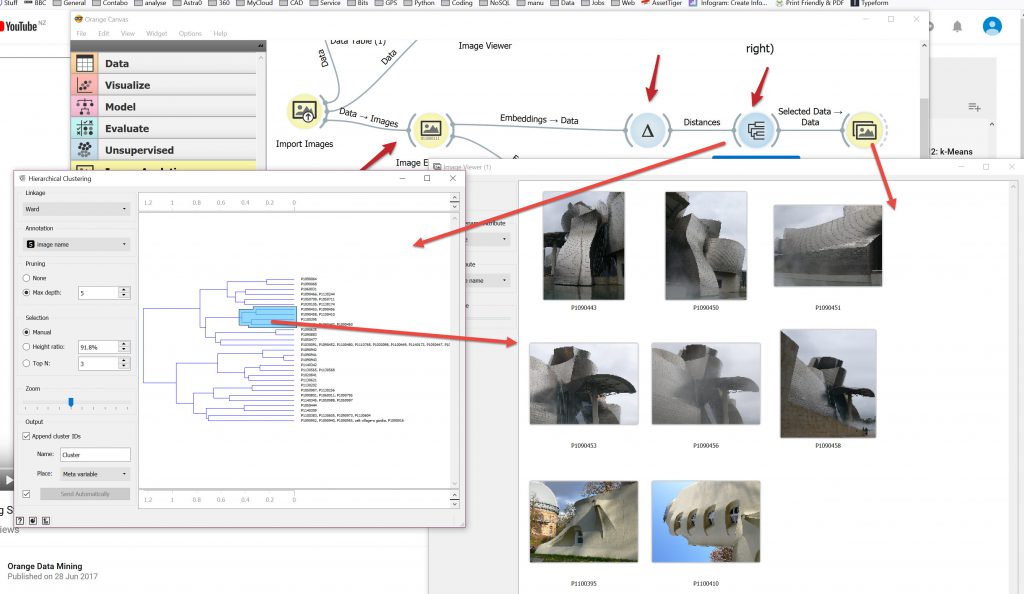
Some of the results were very close, selecting part of the hierarchical tree you can then view the results in the Image Viewer.
The following one was pretty close, The Eionstein Tower & Gugenheim Bilbao. Both builsdings having a lot of curves.
Another cluster that seemed very close was this grouping of castles and monuments. 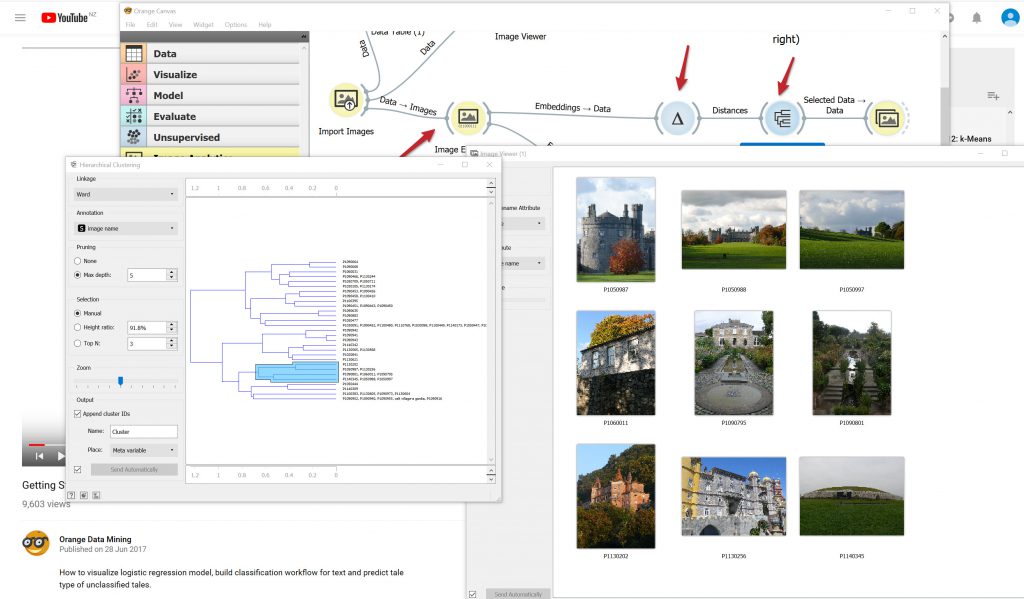
This major grouping almost seems like a bin of “The others”. There does not seem to be much consistency with the images. Maybe on a more granular level there will be better groupings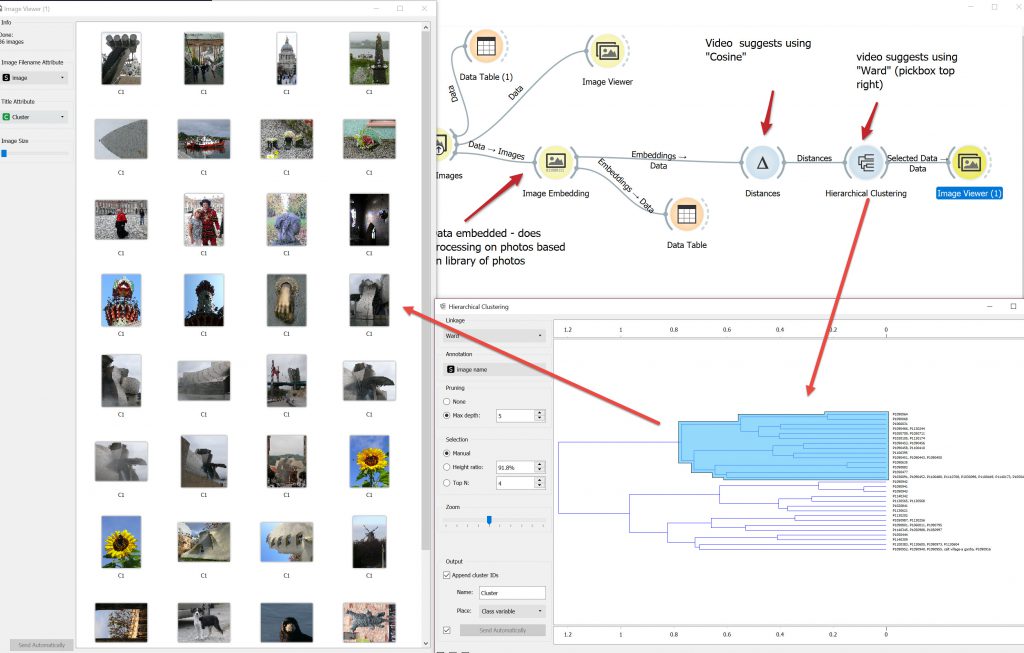
You can alter the clustering depth by changing the numbers in the Hierarchical Clustering node in the left Sidebar which will redefine the cluster groupings.
After adjusting the images to how you want to cluster them you can save the image files with the SAVE DATA node. This actually spat out all 2047 columns plus the original plus the clustering codes to a CSV file. So I deleted all the 2047 columns and kept the clustering Codes. There are also the file names, so you could create an Excel VBA macro that will copy the files to another directory with the Cluster as the Directory (eg C1, C2, C3……) using a process such as this tutorial.
Actually you could do it quite easily with a Python Script (just wondering whether its possible to embed a python script within Orange to do this, (that would be neat)).
So if you had a group of images you could group them by cluster, then inspect the clusters. The ones that are well grouped you’d keep. For the ones that did not cluster well you could run through as a separate process , and also test out different DISTANCES algorithms, instead of the “Cosine” one selected, to see if you could cluster them more effectively.
End Comment
I’m not sure I have a practical application for this workflow at this time. I’m impressed with how it works and how quickly it does the processing.
You could see the process being used for a security camera with still pictures at an entrance lobby, a bit scary in ways.
There is another video on matching image styles matching 2 monet paintings.
I do like the short videos for tutorials but some more in-depth videos would be good, explaining what is going on and how to fix when broken.

How to make Screen Capture Video’s and post to YouTube for free

Free Glide App- make mobile app from Google Sheets