Visual Asset Strategic Tools. Capture Building Information for Building Life Management. Open Source/Low Cost Technology Solutions for you to control your buildings
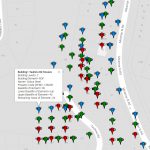
From How to visualise building condition changing over time I extended the asset base from just 3 buildings to many in this post How to visualise building data from databases. Now I would like to look at how to use Maps as a connector to link all your data together on assets so that you
Following on from How to visualise building condition changing over time I extended the asset base from just 3 buildings to many. So the JSON file store was not the method to use, instead I looked at storing the data in a Database, in this case a MySQL database. Video (7min). My first exploration was
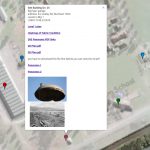
Here is a video (13 min) on a method to how to visualise multiple building elements condition changing over time. To explore the tool go HERE. The tool is based on using the Google Maps API with javascript coding that you can find HERE. The example is based on 3 buildings external elements: Has a
In the table below is the comparison of some CAD & BIM products from Dassault Systems, AutoDesk & BricsSys, and a mention of Graphisoft who conceal their price. Table Embedded Below- You can use the download button for copy of the file (14Kb) Note you may need to scroll table to right to see programme
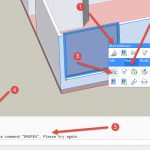
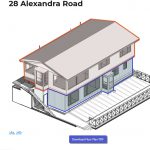
Continuing on with the process of test driving BricsCAD SHAPE by trying to Draw my House I came across another few challenges along the way. In this post I will cover: Layers Cutting/Joining Walls & Floors Components- Windows and editing FastKeys and downloadable list of all BricsCAD keys Briefly Blocks, Materials & Printing Some end
There is a video on YouTube that demo’s the use of BricsCAD SHAPE, it is here: I’m always suspicious of a video putting the programme through its paces as they always make it look TOO EASY, when in fact, when you come to grips with the tool its bloody complicated, or slow or just plain
Free Cad packages are fine, but a lot of time you are collaborating with others who are using the industry common tools and having to save files in a .DFX or other intermediate format ( Revit/ArchiCAD with IFC etc) always causes data loss and issues when transferring to another package, so having something that saves
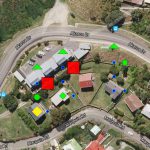
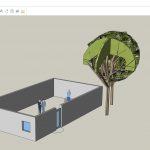
One way to present data is to use an image with hotspots that can either display data about the item at the hotspot on the image or use a link to get data or take you to another page with more information. The two images shows shaded areas (also hotspots that are with plugin Image
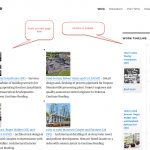
After having a Curriculum Vitae that just listed my jobs/experience I decided to develop an on-line CV with timelines and images. See maxdrake.tk for my resume. There are a number of free and paid Timeline plugins which I tested, I used this blog to find free plugins. After testing some of them out that took
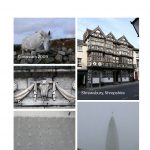
I have been a casual/semi-enthusiastic photographer for years, and have found that I have lots and lots of photographs at the moment. I decided to create a portfolio of my work on the web. One of my interests in building the site was how to manage large sized images and how they looked and loaded