Visual Asset Strategic Tools. Capture Building Information for Building Life Management. Open Source/Low Cost Technology Solutions for you to control your buildings
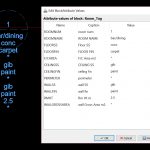
Following on from CAD Data to Excel for Asset Management where I created a BLOCK with ATTRIBUTES and exported that information from a CAD file to a TXT file which was then viewed in Excel. I altered the CASE on a couple of items and deleted one cell so its blank. I then looked at
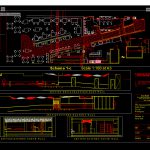
In the previous post How to show CAD drawings on a Web Page I talked about posting CAD drawings to a web page for access to the information. In this post I want to talk about having Data in the CAD file that you can extract to Excel. In DraftSight you can create attribute blocks
After my posts on BricsCAD SHAPE & DraftSight renewed my interest in CAD drawings I started to look at another couple of things about CAD drawings. I looked at extracting data from a PDF file, similar to what I am doing with 3D PDF’s with BIM model. From preliminary reading, extracting Attributes out of Cad
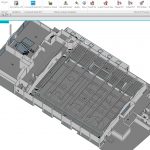
This is the 3rd part of 3 videos. Video (17.11 min) In this video I show how to export from Revit to 3D PDF using SimLab 3D PDF exporter ( $199US for Machine licence (2 machines)) . You can try before you buy & there are other PDF creators. I just found this product to
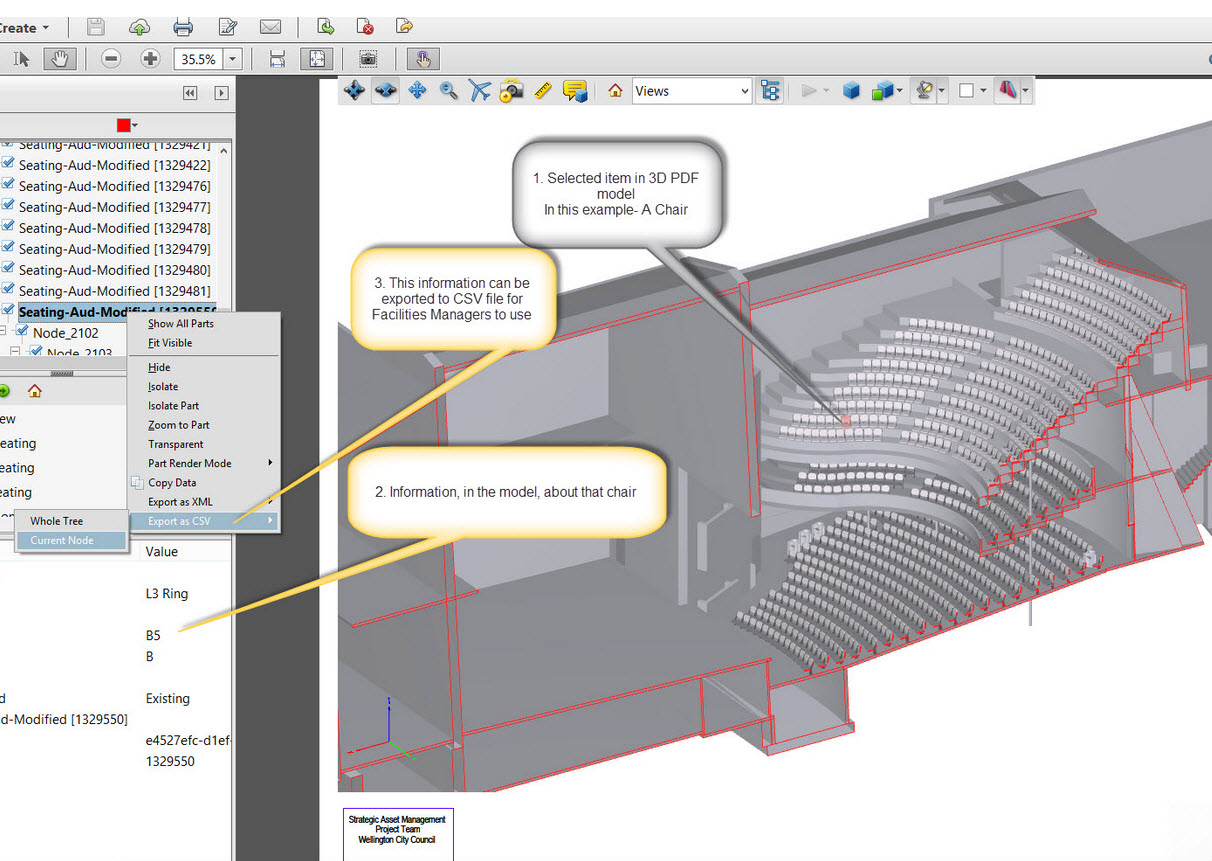
This is the 2nd part of 3 videos. Video (8.58 min) In this video we take the information we exported from the 3D PDF to CSV file and manage that data in the Excel Macro file. We order that information by category so that it is easy to use. The power of the 3D PDF
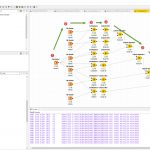
This is the first part of 3 videos. Video (5.40 min) This video shows how to explore 3d pdfs that have been created from Revit BIM. Data created in Revit can be copied into the 3D PDF. We can use the 3D PDF to export this information further to an Excel Macro Sheet where we
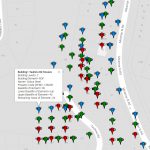
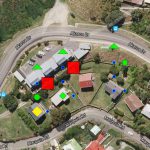
From How to visualise building condition changing over time I extended the asset base from just 3 buildings to many in this post How to visualise building data from databases. Now I would like to look at how to use Maps as a connector to link all your data together on assets so that you
Following on from How to visualise building condition changing over time I extended the asset base from just 3 buildings to many. So the JSON file store was not the method to use, instead I looked at storing the data in a Database, in this case a MySQL database. Video (7min). My first exploration was
Here is a video (13 min) on a method to how to visualise multiple building elements condition changing over time. To explore the tool go HERE. The tool is based on using the Google Maps API with javascript coding that you can find HERE. The example is based on 3 buildings external elements: Has a
In the table below is the comparison of some CAD & BIM products from Dassault Systems, AutoDesk & BricsSys, and a mention of Graphisoft who conceal their price. Table Embedded Below- You can use the download button for copy of the file (14Kb) Note you may need to scroll table to right to see programme