Free Coda.io a great team productivity tool- Part 1
It’s not often one comes across a tool that looks really really interesting where you think you can get some great leverage, but from what I have seen so far Coda.io looks really useful.
I’m even starting this post off with a Part 1 as I expect to be doing quite a lot of exploration with it.
It is apparently developed by some ex-Google people and brings together tools to work with Docs and other information.
One thing to note straight away is that it runs in a browser and only in Chrome.
As someone who admires and uses Firefox initially, this was a negative. Then I thought, what’s the problem, just have 2 browsers open. So you can do project planning in Coda.io in Chrome and get on with normal stuff in Firefox. We’ll see how this works out in the medium term. My phone is an android and although I run firefox on that I think Chrome lurks in there somewhere.
I have had a look at Trello a couple of times but it just seems like a notice board, I really cannot get excited about it at all. I would prefer just to work in email. I have not seen any great advantages to it at all. Coda.io seems to start where Trello finishes. Its a connected space, but has some pretty cool tools.
Coda.io has some OneNote type applications, but rather than being a passive collector and manager of discrete data items gathered and ordered, it actually has the functionality to actually do actions on that data, transforming it into useful information.
The other thing that leaps to mind is how does it work with a large dataset? I often have Excel groaning and slowing from working with large files. Maybe this is not the tool for that, but rather a front interface.
After learning about shared files on Google Drive you just create a link to that location for others to access the large files. Another “to be tested” feature.
Project Setup for dataiknow.info website
So, the best way to learn is by stuffing something up. A particular skillset of mine.
I am a bit “all over the place” at the moment with my new dataiknow.info website. I have completed some service product pages) and linked them to the front DIKW pages but I need to structure my efforts for the other information. There is the contact & About pages to develop and just organizing the workflow to give an overview of where I am at would be great. Also, it allows me to plan when I have the minimum info I need to make the site actually live and other services I want to add.
So, an initial project plan with a couple of timelines would be good.
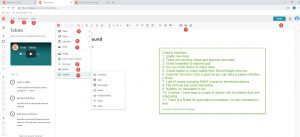
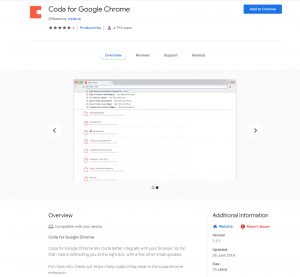
In Chrome, I’m in the middle of a tutorial and tried to open a new doc. It then asks me to load a Chrome extension for coda.io. Which I did.
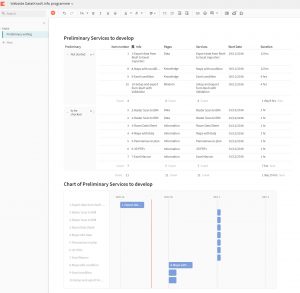
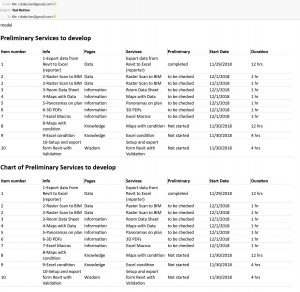
Setting up a basic table and GANT chart for preliminary work
Not totally intuitive and a little difficult to format first time around with a few mistakes.
I am like a bull in a china shop, I partially watch some of the videos and then go and try and do some of the things. I’d watched a bit of a video on Tables then started. My learning method is more ” Break it then figure out how to fix it, or have a go and if it doesn’t work try something else until so frustrated that you look up what you are supposed to do“. Messy but solutions tend to stick in my mind, especially after lots of failures.
The learning resources are good. A bit simplistic. Sometimes I get a bit impatient with slow and methodical as it tends to bore me and I miss out on the relevant part. There are some styles of presentation that suit some people, and completely switch off others. I like fast-paced videos, as you can always go back and re-watch the bits you need.
Challenges
1. GANT chart link. Initially, it created a new GANT chart and a new table, then I tried to link the 2 tables together. I deleted the GANT Chart & 2nd Table and started again but linked the GANT chart to the existing table. Much better.
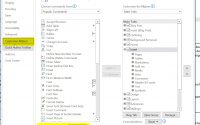
2. It then linked to the Header Column (the one with the BOOKMARK symbol in the column header. That was a pain, as it was just showing the Page field and a lot of those were repeats, so I needed to join two columns together. See item 3 below. The Column with the BOOKMARK symbol is the display column in the GANT chart. You have to Right-click on the column header of the Column you want to display and choose and choose ” SET AS DISPLAY COLUMN” then this becomes the main column.
3. Linking columns- I had columns with page titles (data, info, Knowledge, Wisdom) and wanted to link them to Services. In excel = Pages + “-” + Services. It will do this in Coda.io but a bit sticky. What I mean bu=y this is you put the ‘=” in the cell and it does not react immediately, you have to sort of keep on bashing at it, it might be because its in the browser and fetching the info over the interwomingle, it works but I am an impatient fellow and tent to just keep bashing keys (which really does not tend to succeed).
Overall, the actual doing of setting up the table/gant chart focusses you on the tasks you need to do, I find. Still, a bit of learning.
Onwards
So far, this is really just an Excel exercise, I could have done a simple coloured Cell programme in Excel quicker than this setup. But I have to start somewhere.
One thing with Tables is that you can Cut/paste info from spreadsheets (Excel or Google Sheets). ( First thing I wanted to know was could you export to Excel/Google Sheets? Cut/paste again. I need to test this out).
The automation side and linking to Zapier, hooking into its API. I want to have a look at that.
I still get my weather email each evening from Zapier. I have found Zapier far more useful than IFTTT which seems a bit gimmicky. Whenever I look at IFTTT’s app function lists it doesn’t seem to do anything very productive that I’d want to use. Hopefully, this may.
In one of the videos below on Packs, it says you can create buttons, I did this after installing Gmail pack and then if you hit the button it sent a copy of the sheet to my email of the page section with Table & GANT Chart (although chart came out as the table). I’m sure there is a way to automate this so it sends an email daily so you can track changes in the projet.
 I also tried an automation but I didn’t have the Gmail pack setup, but that didn’t work straight away. I’ll need to research it a bit more. Actually, an email just came in to tell me I’d altered a couple of rows. So I stand corrected, I’ll need to check the timing I set on the event to see if I’d put a delay on it.
Resources
These are a few of the automation videos and chain coding vids I thought were interesting:
End thoughts
I think this is a pretty cool programme and its free at present.
The useful things in this programme that I like so far:
Easily create/ alter tables and group by a specific column. It also has filters
GANT chart. Quick and useful. I find them handy but do not like complex ones.
Buttons linking yo apps such as calendar, email.
Functions. These I really want to explore.
Automation for notification could be good for updating other sheets or sections. A bit like linked sheets (although I’m usually very nervous about these as you’re never sure if they are always operational or broken).
Anyway, this post has been a distraction from my main objective for getting the Website up and running, so at the moment a distraction rather than a productivity tool but it does have potential.
I will have to explore the templates next to see what cool things people are doing with this programme.
One thought I did have is that ithas packs for links to Gmail and Calander but I haven’t seen anything for linking to Sheets and other docs (maybe through zapier) and also Google Drive. A little bit of research on that theser topics too I think.
I would definitely recommend it to thers to try.
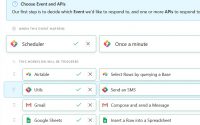
StdLib API automation test with AirTable, SMS message, GMail & Google Sheets
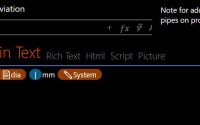
aText Premium using with Revit