Visual Asset Strategic Tools. Capture Building Information for Building Life Management. Open Source/Low Cost Technology Solutions for you to control your buildings
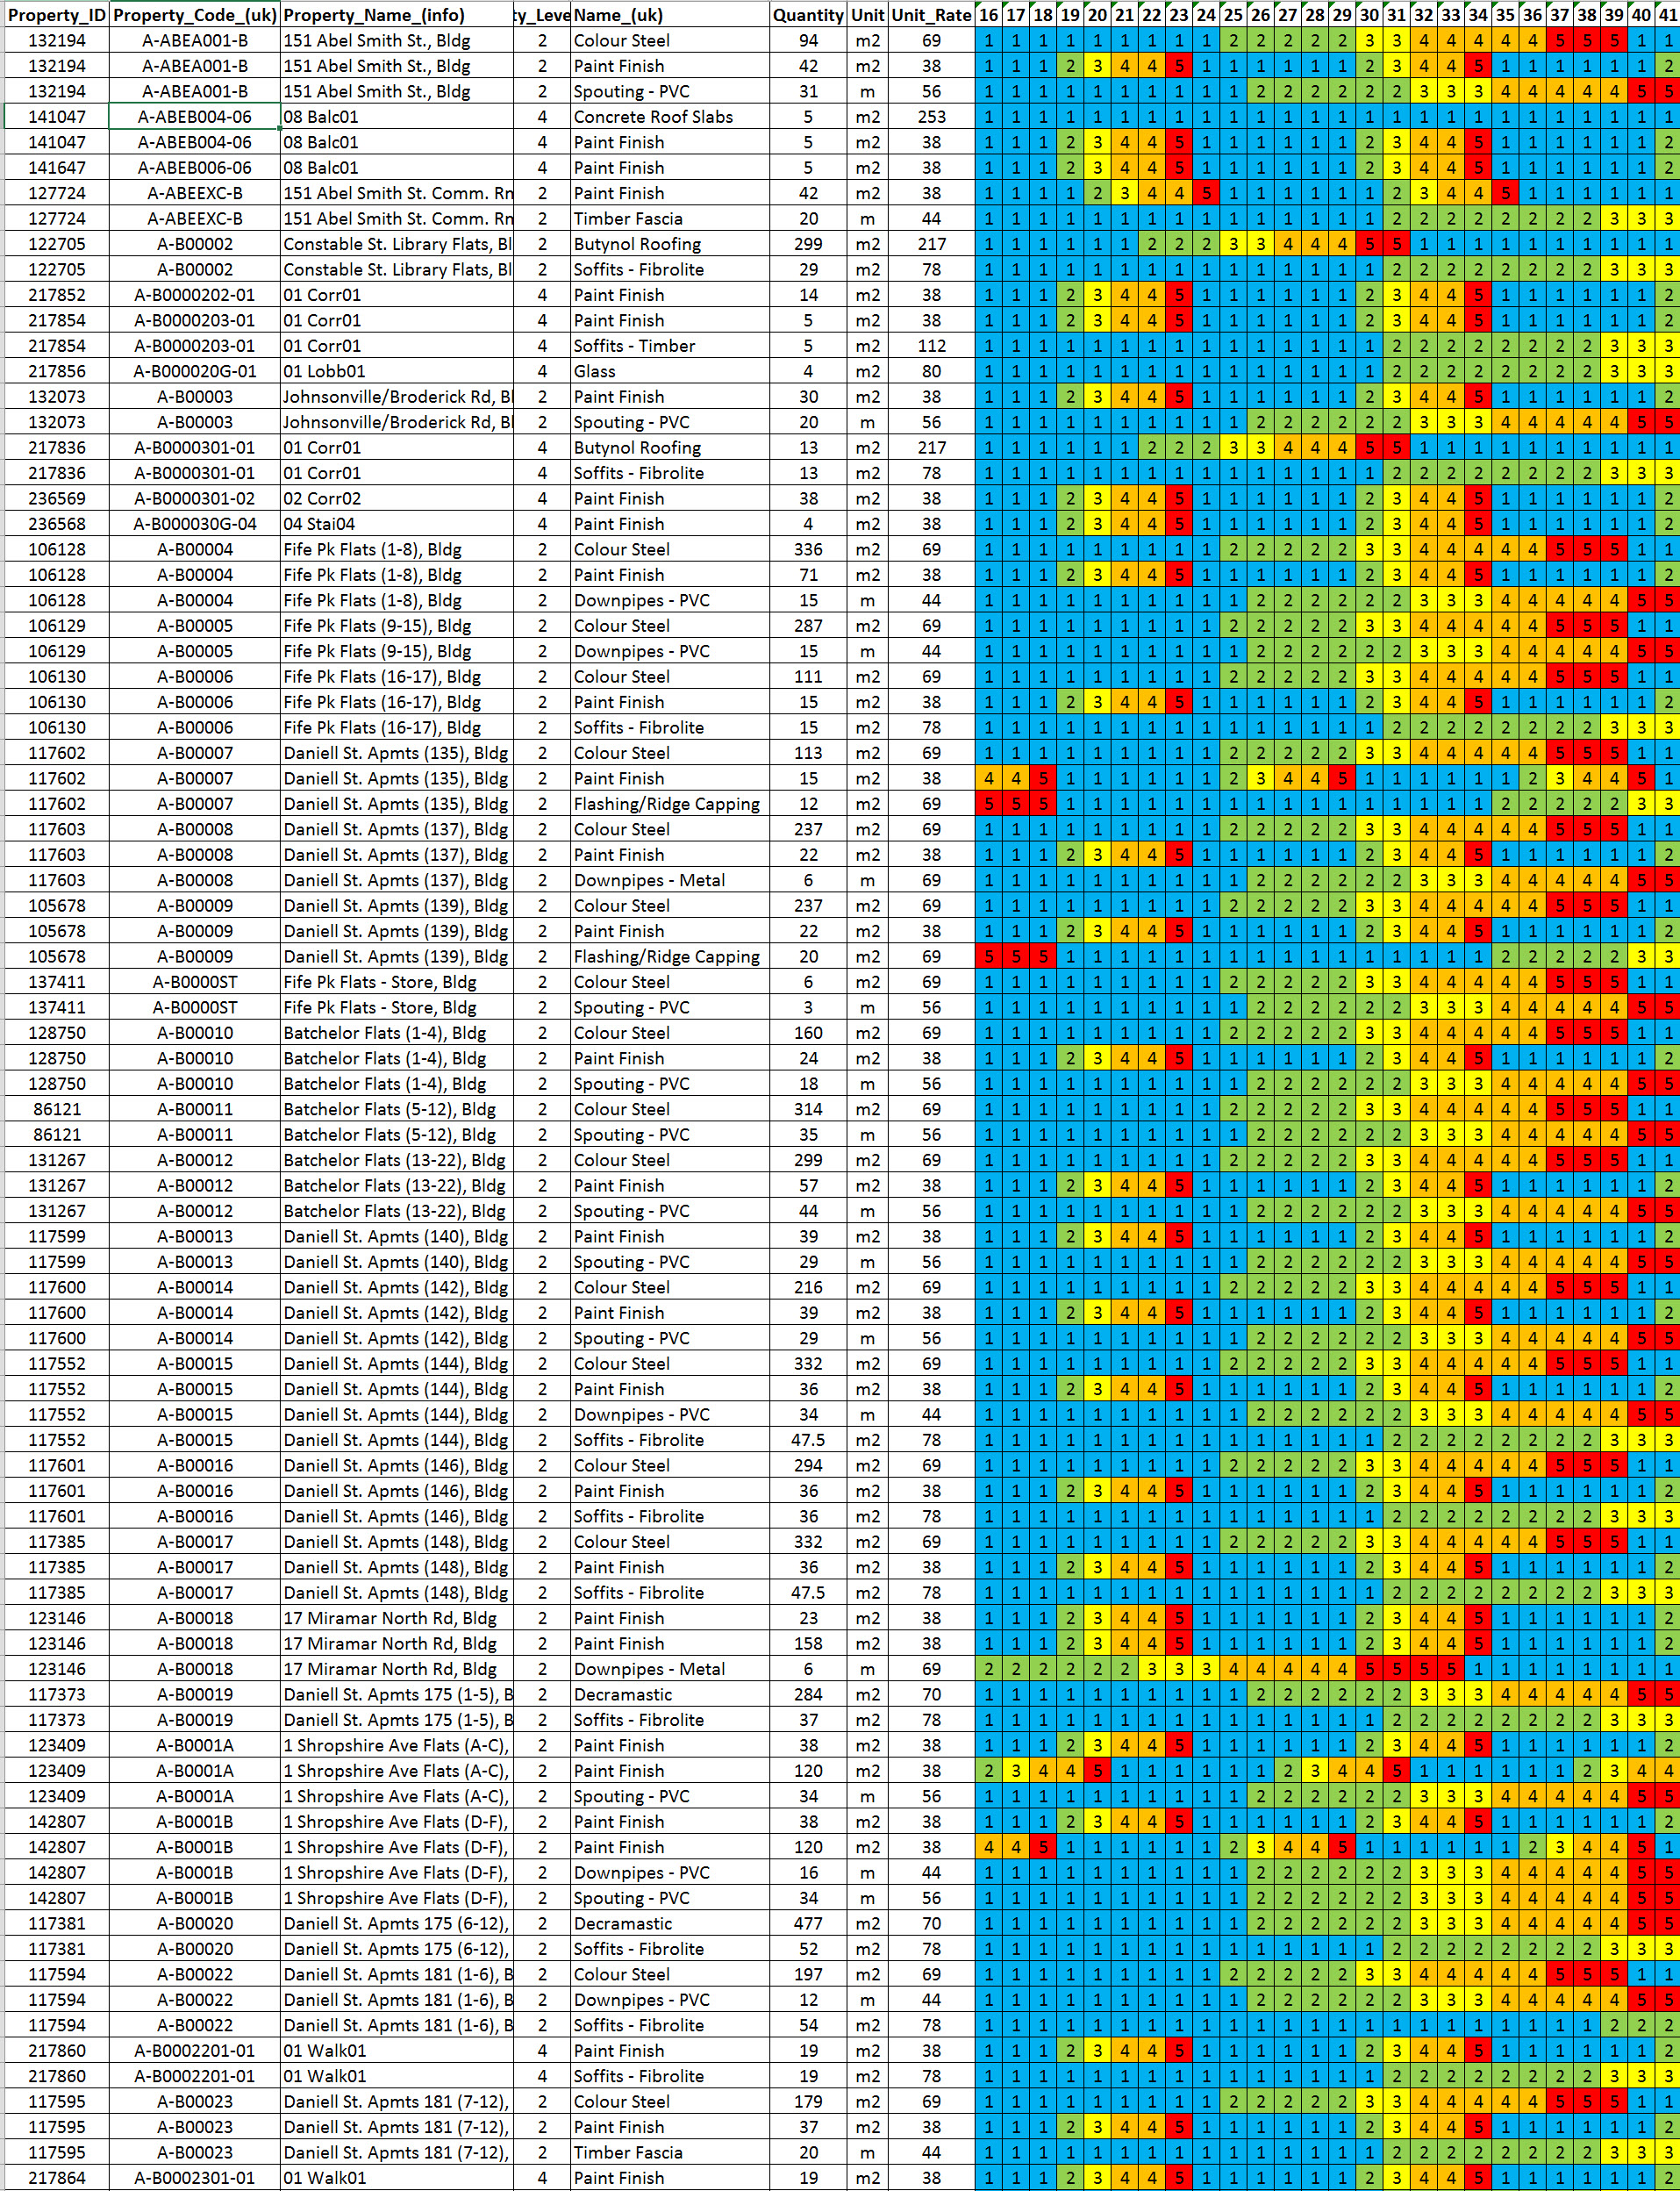
A method for showing condition heatmaps is using Excel to display the condition of the elements over time. Another post Heatmaps for visualising exterior and interior space conditions uses D3.js heatmaps. The good part of this is that you can use filters to explore the information and drill down into the data. Video (4min) I
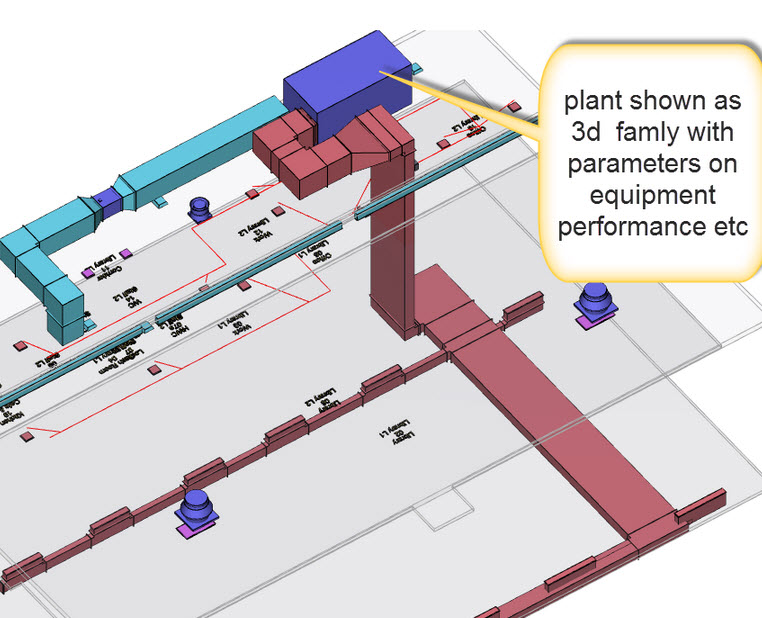
In the first article here regarding capturing building services data on existing buildings, the focus was mainly on discrete components that sit in a system, with for instance lights, there may be an issue regarding which circuit they are linked to which switch or circuit fused in a sub-board, and this could easily be added
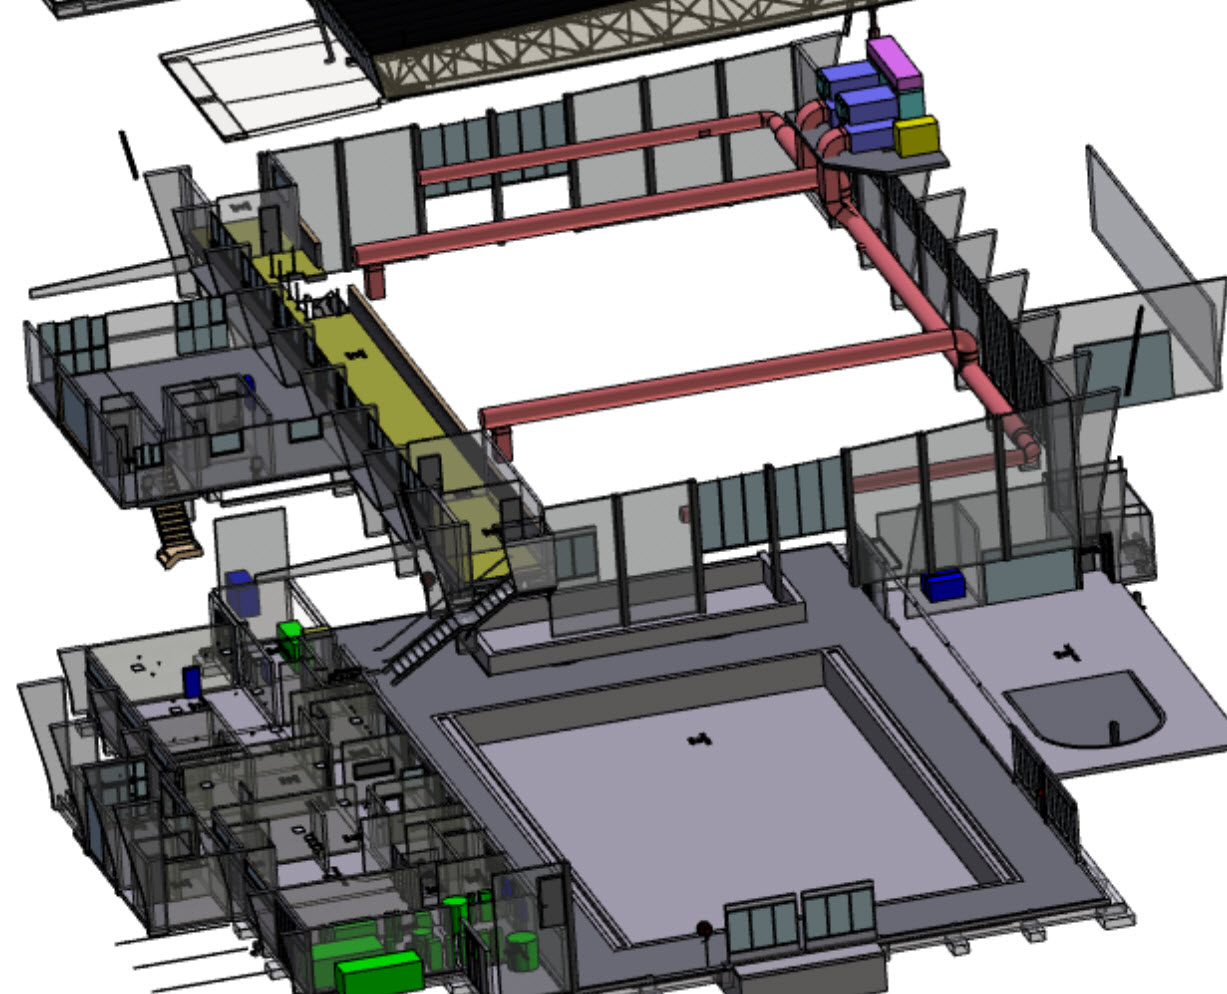
For new assets, if BIM models are used for design/construction then the modeled services are available for use in FM stage of the project. If there are existing assets that are partially through their lifecycle and services data is required for them, then you will need to consider the level of information that you require