API tutorial with Covid data, Postman & JavaScript to webpage
I want to play with 1/ Covid Data & 2/ API’s. I’ve done some bits with Postman & API’s before but not very successfully. So this time I’m watching the following video:
It is pulling in the Postman scripts for the API calls and I want to follow on with what they are doing.
After opening Postman, new template and searched for Covid, then got list of Covid sites, these do not need an Authorisation code so you can just grab the data.
I’m using a GET request on https://covidapi.info/api/v1/country/USA which is John Hopkins series on USA historical data from 22 Jan to 6 April re Confirmed, deaths & recoveries.
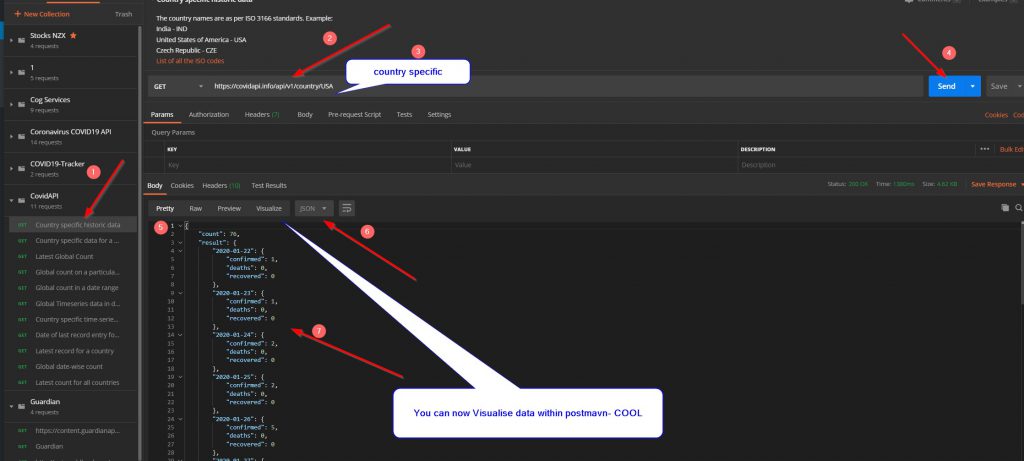
After getting the data pulled in, you can now visualise it inside postman, see the video below:
Results at end of day 1 with postman & API
I had a bit of trouble, my code did not visualise as per the top video, although I got part of it showing with hard coded data. Also after playing with it, I thought I could transfer the code straight across to my web page and use it there, not so. Oh bugger. So I sort of had to start again to look at a way of making an API call and displaying data in a chart on a web page. Postman tested the API and I could look at what was returned. I need to do more to get it on a web page
Day 2 , JavaScript Fetch()
I went to Mr U tube and found this series of coding for what I was interested in Series 1, client side basics (I didn’t want to get into JQuery and the rest, just something simple) , a really good series and it got me started doing the infomation that I wanted but not quite my situation:
Specifically, 1.3 was good as it used Charts.js , exactly what I wanted, but he was parsing CSV data from a file, I wanted to call an API:
So after watching the series a couple of times I ended up watching lots of videos because I could use the FETCH command on this api endpoint: const api_url =” https://covidapi.info/api/v1/country/NZL” and it would return the whole JSON file :
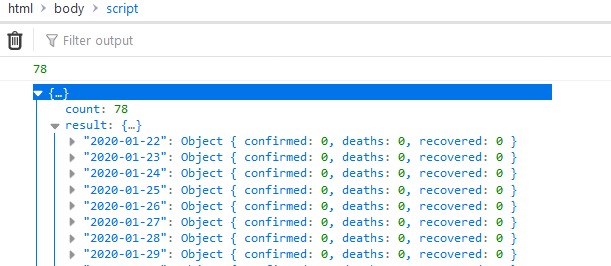
With 78 lines, a data.count which in console.log( data.count ) gave the correct answer, and if I did console.log( data.result) it would spit out the Array for the result above, but if I then tried different combinations of data.result[0] or data.result[0] .deaths and any variations with square brackets trying to call items in the array I just got UNDEFINED. So after wasting a lot of time doing that I finally went back to the API itself and looked at the docs. So https://covidapi.info/ sent me to https://github.com/backtrackbaba/covid-api which gave several variations on the endpoints:
Examples
- How do I get the global data on any given day? You could use the
/api/v1/global/2020-03-15endpoint - How do I get the data for a country in a date-range? Ex: To get the data for India between 10th and 19th March 2020, you could use
/api/v1/country/IND/timeseries/2020-03-10/2020-03-19 - How do I get the data for the last record for a country? Ex: You’ll need to get the last date for any country by hitting the
/api/v1/latest-dateendpoint and then use that date to query the country endpoint like this/api/v1/country/IND/2020-03-15
So I modified my endpoint to https://covidapi.info/api/v1/country/USA/timeseries/2020-02-28/2020-04-09 and then when I started to do :
var data1 = data.result;
// console.log(data1[i].date);
//console.log(data1[i].confirmed);
//console.log(data1[i].deaths);
//console.log(data1[i].recovered);
I could reach in and get specific items in the array. Huray hurray, what a wonderful day! I could use DATE to grab the date information, I guessed at that, but when I went back to original API endpoint and tried data.result.date[0] that didn’t work. Anyway, I have something working and I wanted to get a chart on my web page.
I can now iterate through the data to be able to put it on a chart. I did have trouble getting the string to be able to put the required code in label: & data: in the code below, but finally came up with a solution after the code below:
var ctx = document.getElementById(‘myChart’).getContext(‘2d’);
var chart = new Chart(ctx, {
// The type of chart we want to create
type: ‘line’,
// The data for our dataset
data: {

    labels: document.getElementById("demo").innerHTML = dates,//['January', 'February', 'March', 'April', 'May', 'June', 'July'],//data1[i].date,//
    datasets: [{
        label: 'My First dataset',
        fill: false,
        backgroundColor: 'rgb(255, 99, 132)',
        borderColor: 'rgb(255, 99, 132)',
        data: document.getElementById("demo").innerHTML = death    //[0, 10, 5, 2, 20, 30, 45]// document.getElementById("demo").innerHTML = car

    },
So, I pinched a bit of code from somewhere and made it work, I was on the W3Schools.com and there was an array demo https://www.w3schools.com/js/tryit.asp?filename=tryjs_array that I took the code from to display the Label : and Line points. A bit of a hack, but it works.
Then, after that I wanted to look at using multilines with Charts.js and got that working too at a basic level. So at end of day image below is as far as I got. I didn’t realise the pain it would take to get that far.
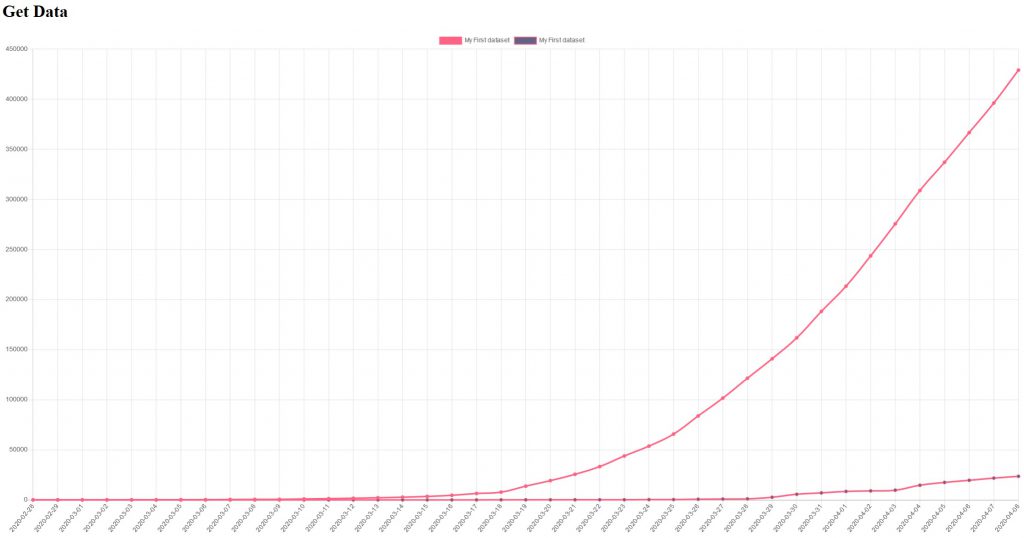
This is generally messy code I end up with, using JS but, at present, it works.
So, I can call a country, using an ISO 3 letter country code and put some dates in and it will graph them.
End comment at end of day 2
So, in summary, I can, from my web page, make a call to an API on Covid Data, pull that data across and display it in a Chart on my web page.
Day 3, Data Structure and what I want to display.
I have the basic data from the API which is “cumulative” information on how many people are either “confirmed” infected with covid, have “died” from ot or have “recovered” form it. So generally there is just exponential curves going up as there are more, day by day. There are a lot of charts doing that, but what I want is to show the daily increace/decrease in these figures. And later, I may want to do comparisons between different countries, but for present my covid map is of NZ only.
Chart into dashboard. Issues about structuring Data and how/where to get it
One thing I need to do is put the chart data on the overall Covid Dashboard:
And it fits on the page in the first <DIV>
This is now an issue. I am getting data from MoH via a Web scrape, and getting daily data from an API call, so coding 2 seperate sources of data.
Going forward, do I try and build the api call and chart into the Excel file, or do I do a link?
As this is a learning exercise, starting with basics HTML and map and Excel and then exploring getting information via an API, I think what I need to do is accept that if I want an elegant solution it would require a rebild of what I’ve done so far.
With that in mind, the way forward is to put a static chart image on the Excel generated coded site and link through to another page that is doing the API call. That way I can look at one page , all Excel web scrape, and another page all API calls.
This may be the way to do that, have a button that takes you to the chart page: https://www.w3schools.com/howto/tryit.asp?filename=tryhow_js_redirect_webpage
This has been done for the 2 pages.
Json data for Chart from API
So , I have a JSON file giving me cumulative figures in an ARRAY format, I need to do some JavaScript manipulation of that data to be able to subtract todays figure from yesterdays figure, Eg X- (X -1).
As JavaScript gives me so much pain I’m taking it really slowly today. Overcoding like mad, but hopefully it will pay off.
Doing an array subtract will break as there is a null at one end or the other of one of the arrays. So I have to copy the original Array of data and then remove the last item from one array and the first item from the 2nd array and then I can subtract one from the other to get daily increase/decrease, but you have to use Array.slice() to clone an array, as if you just make ArrayA=A , then A does exactly what ARRAYA does. Also use A.pop() to remove lat item in array & A.shft() to remove first item in Array.
<!DOCTYPE html>
<html>
<head>
<meta charset="utf-8">
<h1> Test Subtract Arrays  </h1>
</head>
<body>
<script>
//var a= new Array(1,2,3,4,5);
var a= [1,2,3,4,7];
var minusLast=a.slice(0);
var minusFirst=a.slice(0);
console.log(a);
console.log(minusLast);
console.log(minusFirst);
minusLast.pop();
console.log(minusLast);
minusFirst.shift();
console.log(minusFirst);
console.log(a);

var dailyChange = minusFirst.map(function(item, index) {
  // In this case item correspond to currentValue of array a,
  // using index to get value from array b
  return item - minusLast[index];
})
console.log(x);
</script>
</body>
The results are as below , so Array x is correct. I need to make another for the Date and remove the first item in the array.
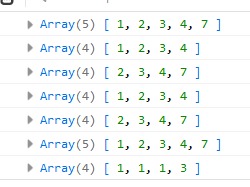
So concept works with some hard coding on a basic array, I now have to add this to my code for the chart. Also, maybe a bar chart is better than a line chart.
After playing around with it I got it working for all 3 series, see below. There is a string of numbers (deaths) that is showing up, I think its the last array and the numbers are bleeding out via data: document.getElementById(“demo”).innerHTML = dailyDeadChange
as the last series in JavaScriptdoesn’t have a comma at the end I think, and its going back up to the ElementById (“demo”) and writing it inside the <p> brackets. The principal is sound, just a bit fuzzy on the execution.

End comment day 3
This went pretty well, not too many curly issues with JS, but I used a lot of console.log() to check the output as I went, also the code is verbose, but it works.
It took a lot of messing around to split Excel stuff with API call onto 2 different pages. But as this is a learning exercise that is fine, but high maintenance going forward.
I ended up taking a bit of time with the Excel import from Web as the imported tables shifted and I had to do a bit of tidying up to get them right. That will be an ongoing thing with using that process. Hopefully the API call will need far less maintenance.
I’m wondering about exploring API’s as far as building one to store the data in, then calling it as I need it in a JSON format. That might be an interesting project.
So far, this is specific to NZ, I’m interested in making a more general API call to be able to chage Country via a pull down list and choose dates too.
Also, I’m keen to explore using JS Template literals too.