PSPP, free tool for statistical analysis also iNZight, SofaStatistics & Jamovi
I was viewing the free statistics-101 course from Cognitive Class.ai and they recommend using the SPSS statistical tool by IBM which you can use on a free trial base for 14 days. I came across a free tool PSPP which is based on the SPSS tool but is freeware when looking at this video on free data journalism tools.
I also come across another Free statistical/Graphing tool called iNZight for Data Analysis. This has an On-line tool iNZight lite as well, where you get a simple web page interface and can download a file to explore/analyse. (Nice to see a Kiwi Package out there, there is also WEKA for Machine learning but I havent explored that yet either). See the video here:
I also came across AlternativeTo website that shows alternative software. Two free ones that looked interesting, and do a similar function to this programme are Sofastatistics and Jamovi. I only mention them here but may try them out later.
PSPP
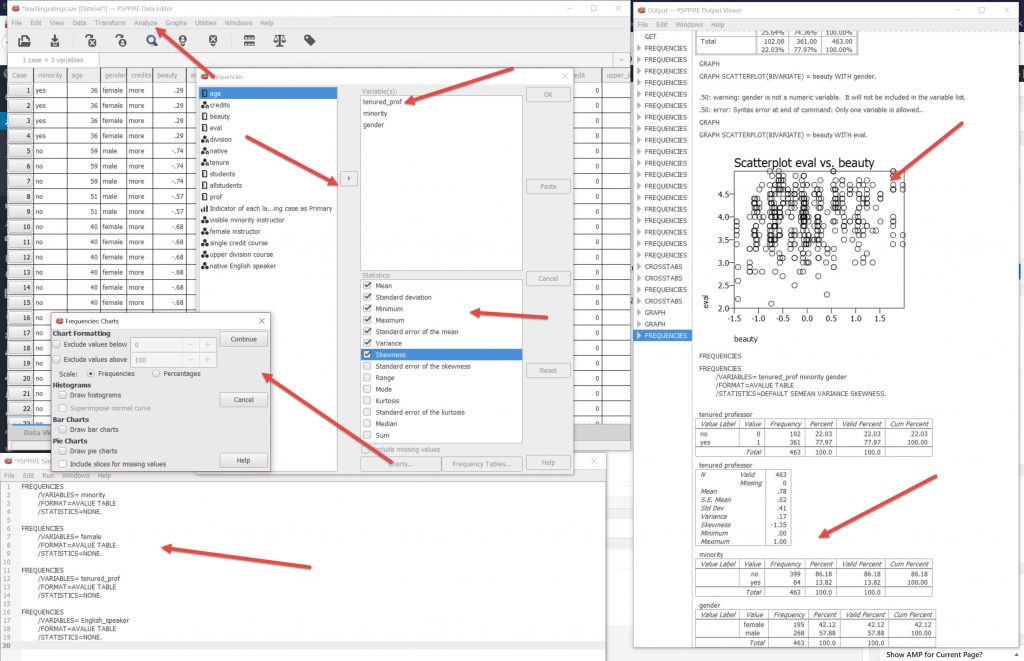
There seem to be a few things you can do in IBM SPSS that you cannot in the free PSPP like Tables & Pivot Tables but overall it is a very useful statistical tool. Not that intuitive though, so you need to watch a few videos on how to manage it.
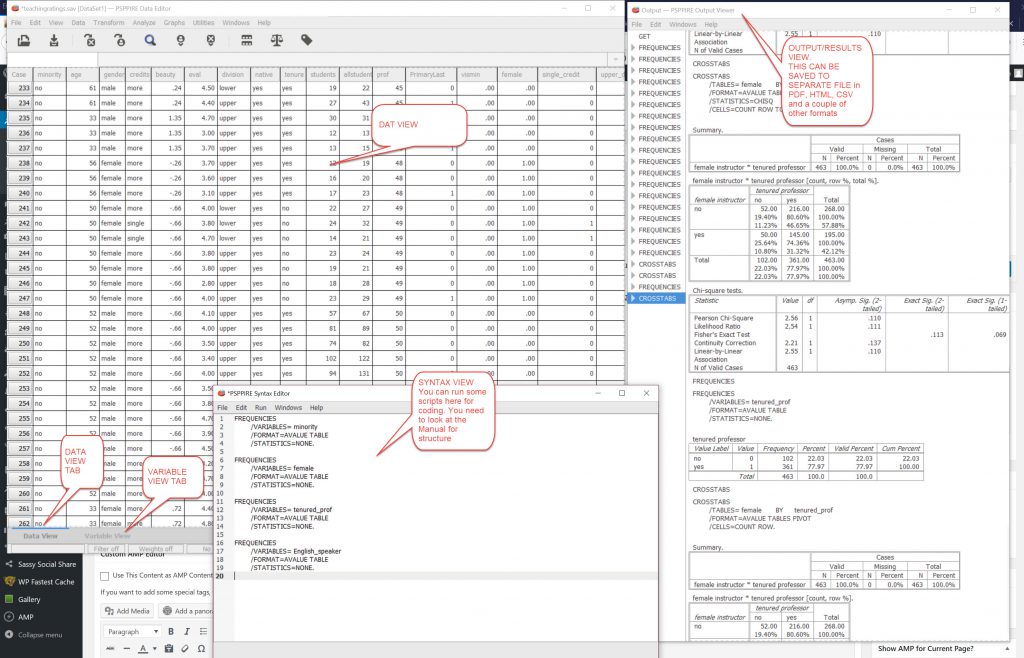
There are 3 interfaces.
- The Data/Variable interface, that shows you the data tables and what the variables are defined as in the programme. (file saved as .SAV)
- The Output interface that shows results in line, table and charts and can be saved to external files in TXT, HTML, PDF, CSV and PS formats (note, when writing the file make sure you write the extension too.)
- The Syntax Interface. This is where you can write scripts to run on your data. You can safe these scripts to be used again. Note, the Scripts from IBM SPSS can be used in the PSPP programme, so if you see a video/example in SPSS on a specific dataset, it may be able to be reused in PSPP. (file saved as .SPS)
Importing Data
One of the first challenges that I found was getting data into the programme. The programme saves the the file in a .SAV format. So to get data into the programme you have to import it. It will import from TXT , CSV, TSV and ODS (open Document Spreadsheet). This will not always happen. I have had to go and reduce the dataset and tidy it up before it will import some CSV files, I have also tried converting the CSV to ODS format to try and import the data.
I found this video useful on demonstrating the import process.
Download & Help Files
You can download the programme here.
There is an Online Manual here.
Generally I find going onto YouTube the best way to pick up information on how to do things the quickest way to find out about a programme but there is not a lot of information on the programme. I think it is one of those tools you just have to practice with.
I did find the course mentioned at the beginning of this post very useful, that is also a good resource.
Why use it over a spreadsheet?
Why not just use Excel or some other spreadsheet tool? I think because this is a specific statistical tool.
I get nervous with Excel with embedded formulae in the tables. This starts out quite clean and although you can put formulae in the columns it is done a lot more consciously. It is also a specific to its function rather than being a generic tool.
I think for general pivot tables and preliminary data exploration a normal spreadsheet would suffice but when trying to drill down to get exact statistical information I would have a lot more confidence in this tool.
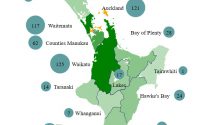
Covid by region NZ -map representation- Part 5
Covid Globally -Rates of change visualisation- Part 4