Python Analytics & My electricity Prices- Part 3
Distributor, Administration, Metering charges and the EA levy component modelling
Continuing on from Python Analytics & My electricity Prices- Part 2 & Python Analytics & My electricity Prices- Part 1 I did a quick summary, after receiving information about additional charges for Distributor, Administration, Metering charges and the EA levy components, of which I got the following information:
- The Generation charges are per kWh for each POC. Your POC is CPK0331.
- Distribution Charges (which also include Transmission Charges) for Inclusive Meters like yours are currently $0.30 per Day and per kWh rates of Peak (weekdays 7-11am and 5-9pm) $.1075 and OffPeak of $0.0575
- Administration Charges are $0.03 per kWh
- Metering Charges are $0.15 per day and .005 per kWh
- EA Levy. We currently charge $0.001 per kWh to recover the EA Levy.
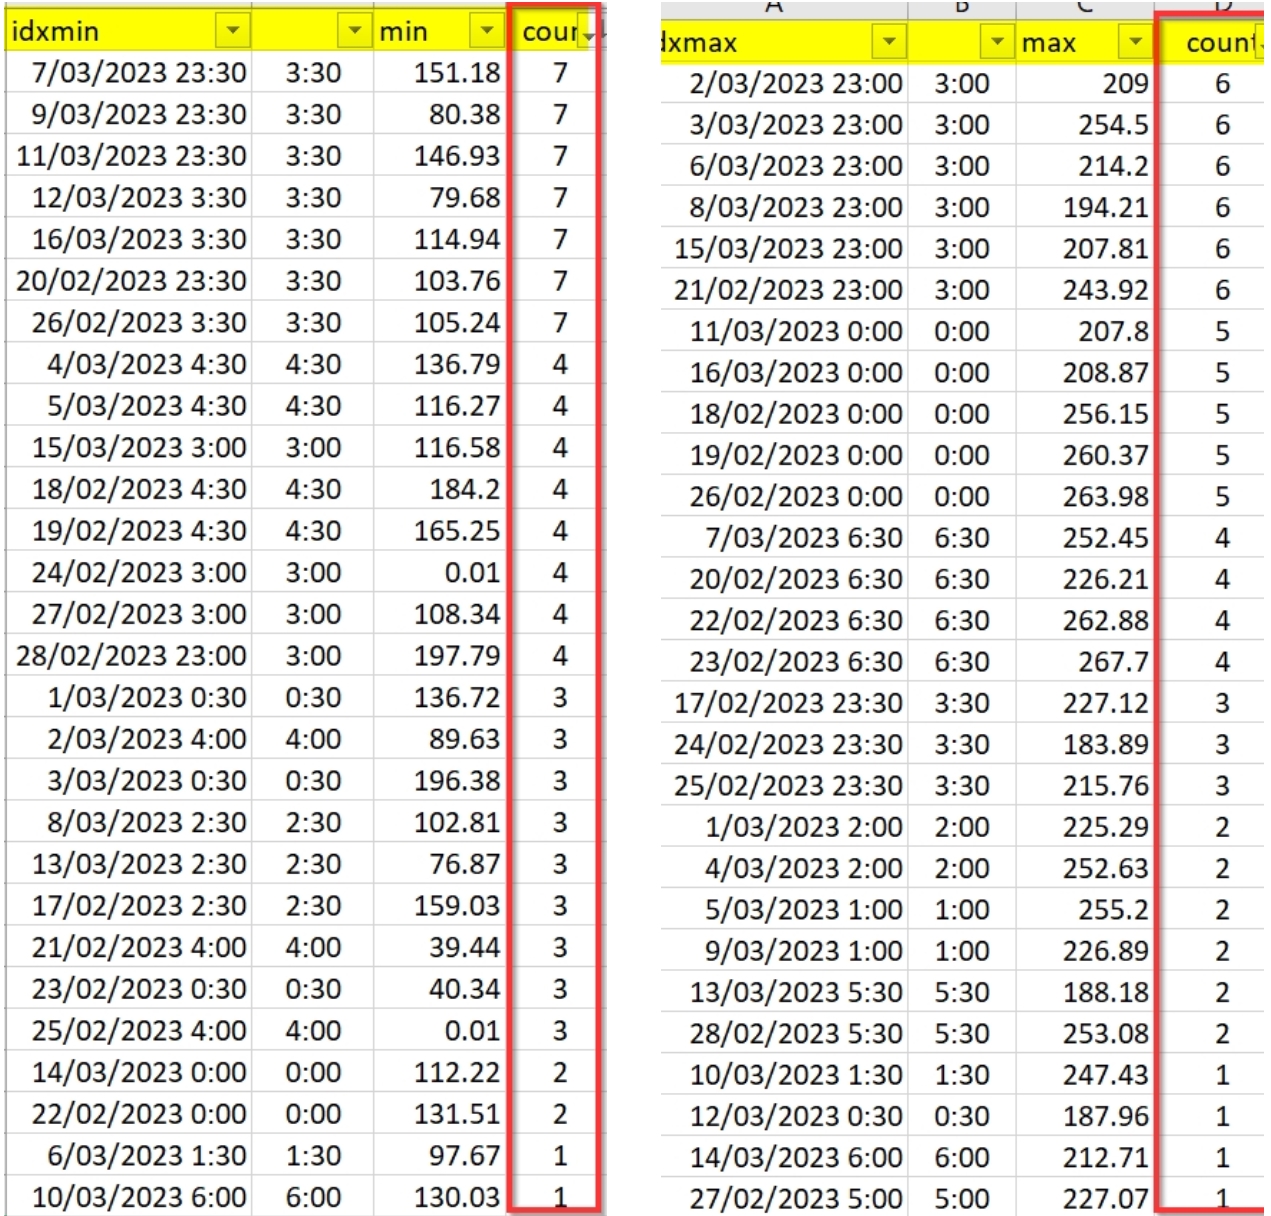
So I used my existing spreadsheet to see if these matched what the bill showed the following results:
Administration, Metering charges and the EA levy components all matched what was on the bill, but the Distributor charges didn’t, they were above what I expected.
Then I reviewed the Distributor Charges – Distribution Charges (which also include Transmission Charges) for Inclusive Meters like yours are currently $0.30 per Day and per kWh rates of Peak (weekdays 7-11am and 5-9pm) $.1075 and OffPeak of $0.0575.
The key points for this is the Peak rates are 1/ only for weekdays & 2/ the morning peak is only from 7 to 11am, not the 7-12pm band in the bill.
So my python modelling & binning of the daily timestamps into the 5 bins are not correct. I need to be able to split them into different bins to identify peak times AND to be able to split by Week days and weekend, so further refinement is required and I will need to use the new dt.dayofweek property (see this SO article) to be able to split by days of week.
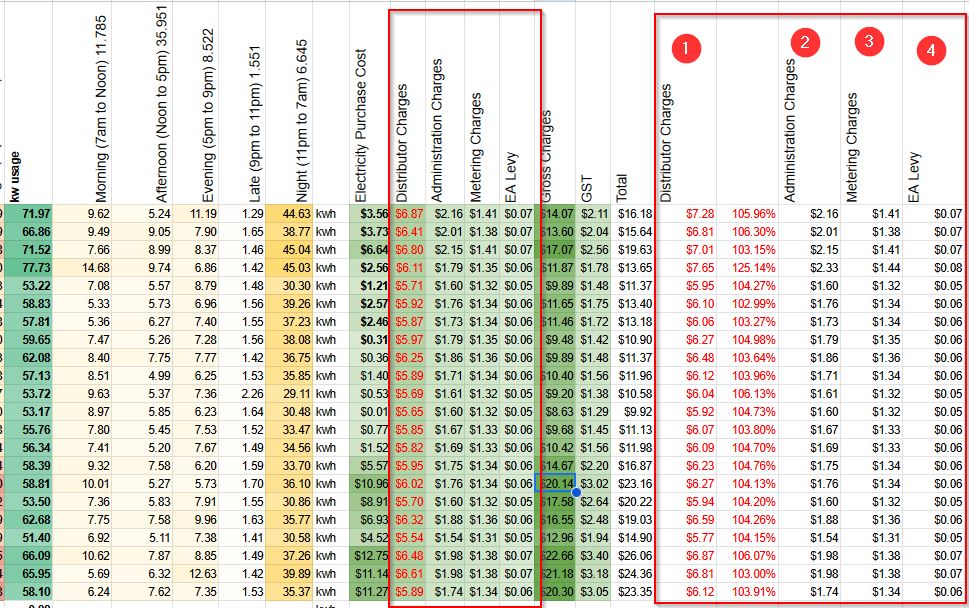
Reviewing the above model for Distributor Charges
The distributor charges are a bit high, this is because the time period is from 7-12pm instead of the 7-11am peak period, so I tried adding a 4/5 multiplier to the distributor charges cost and it was a lot closer for most of the results, one row was an anomaly, but the rest were in a couple of percent of the sum. I also tried adding the last 1/5 to the off-peak charges but this only inflated the sum higher, so I left that out.
Because I only have the aggregated sums from the periods on the bills I cannot see hourly usage of power, but as its spread over a week (7 days) so hopefully it will generally even out to being distributed equally across all the hours in that time period. At the end of the day, as I do not have direct access to my meter readings showing usage this is the only assumption I can make. Generally within 2% is OK.
I do wonder if there is a way I can get my hourly power usage.
Mid-article comment
At this point I can sort of analyse my bill and also, with some refinements to my current method of processing the EA downloaded csv data, be able to make a general stab at my next bill, including all the other charges. I still need to refine the script from the first article, and adding process modeled in Excel in this part I should be able to get a realistic idea of my next weeks bill.
As this is dealing with received bills it is retroactive analysis, since it is in the past. So I want to look to see if I can get data of what suppliers anticipate the demands to be in the future. If I can access this in a practical way then I can then plan to make a dashboard to give me clues to what is happening in the future.
So I’ll look at the WITS Dashboard & API to see if I can see forward trends that may help me to make a choice in my future power use behaviours. I do really only need to look out for the next day or two to see what is happening.
Futures with WITS (Wholesale Information Trading System) & API
There are dashboards for prices that indicate what is to come, HERE, which I will explore to see if it helps in planning electricity usage. May be worth developing a dashboard and hook in an API for the data.
I started to tinker with the API , you can test with their Market Prices API test. It requires a Bearer Token, that, if you put in your ClientID & Secret keys it will generate one that is current for 2 hours.
I am waiting for an email confirmation to allow me to activate my own (like the PRIVA API calls) so I am only getting test data output at present. The time formatting was a bit of an issue but I finally have something sorted for that presently, also the Datetime format in the string needs ascii codes for some of the symbols that I’ll have to write to adjust. Not a major but fiddly.
Currently I’m able to download data in JSON format, I just DON’T really know what it means. The interesting thing is that I am able to get data forward of current time, so this can allow for predictive data that I can use.
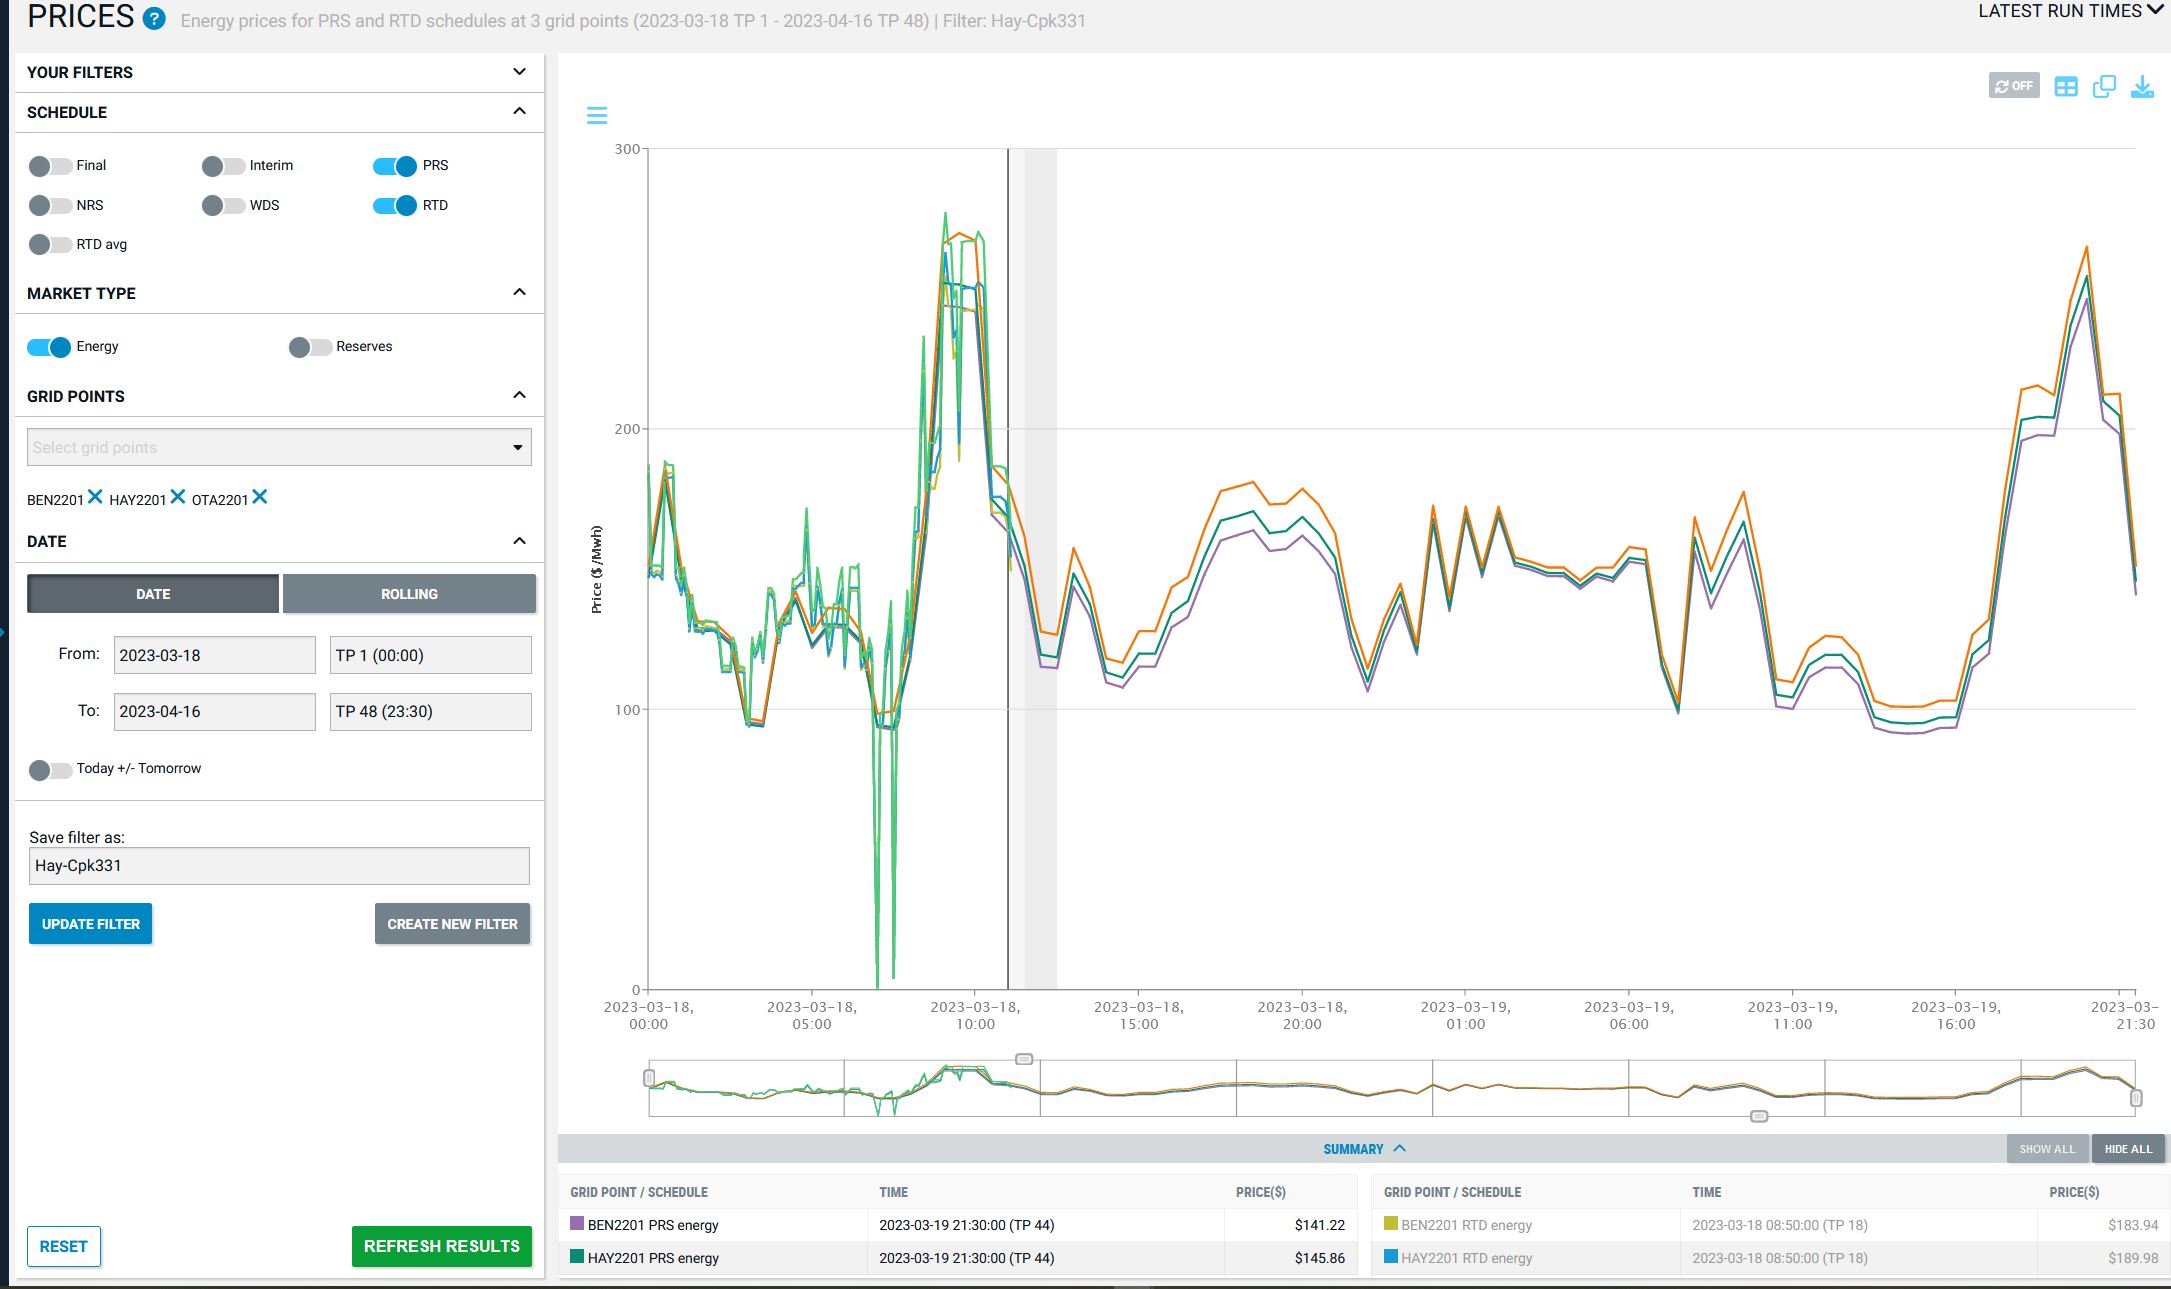
There are a few different lines that can be drawn on the graph, seen in the top left of the image above, Final, Interim, NRSL, NRSS, PRSL, PRSS, RTD, WDS and these show different things.
In image below There are RTD (Real Time Dispatch- Lime colour), PRS(Price Responsive Schedule- Purple) & WDS (Weekly Dispatch Schedule- Dark Green).
There is a help page explaining these codes HERE. See end of article for more information
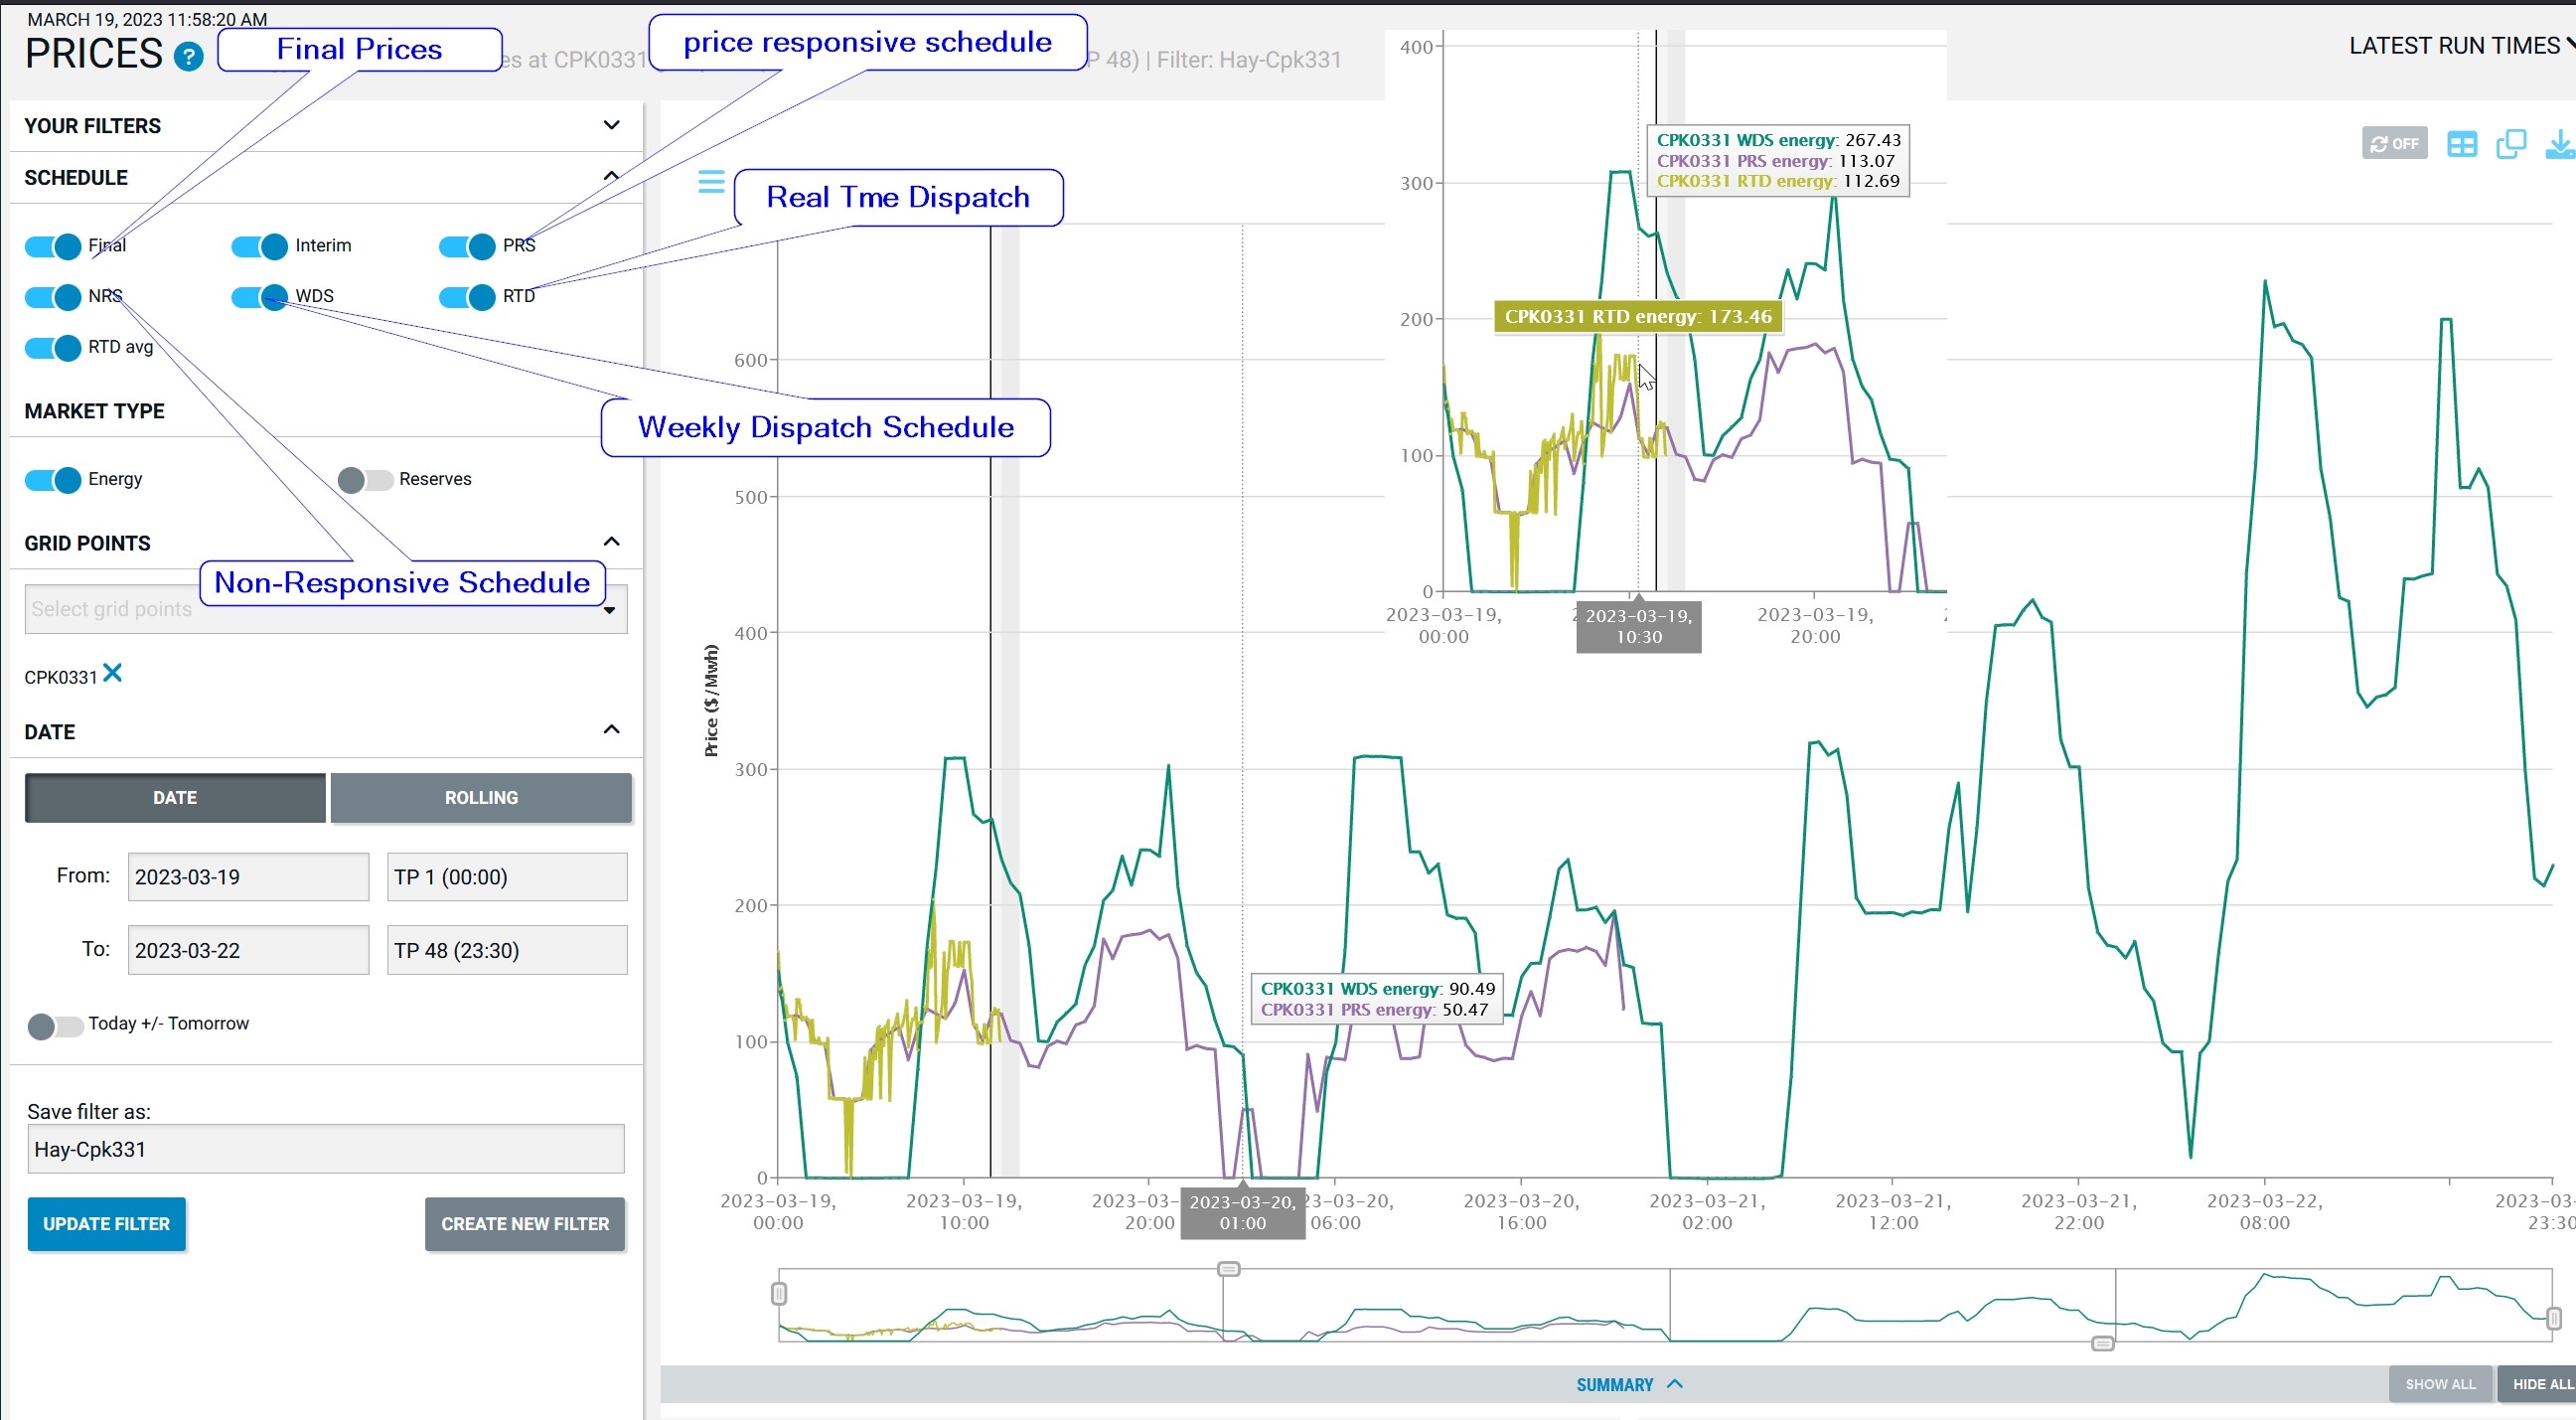
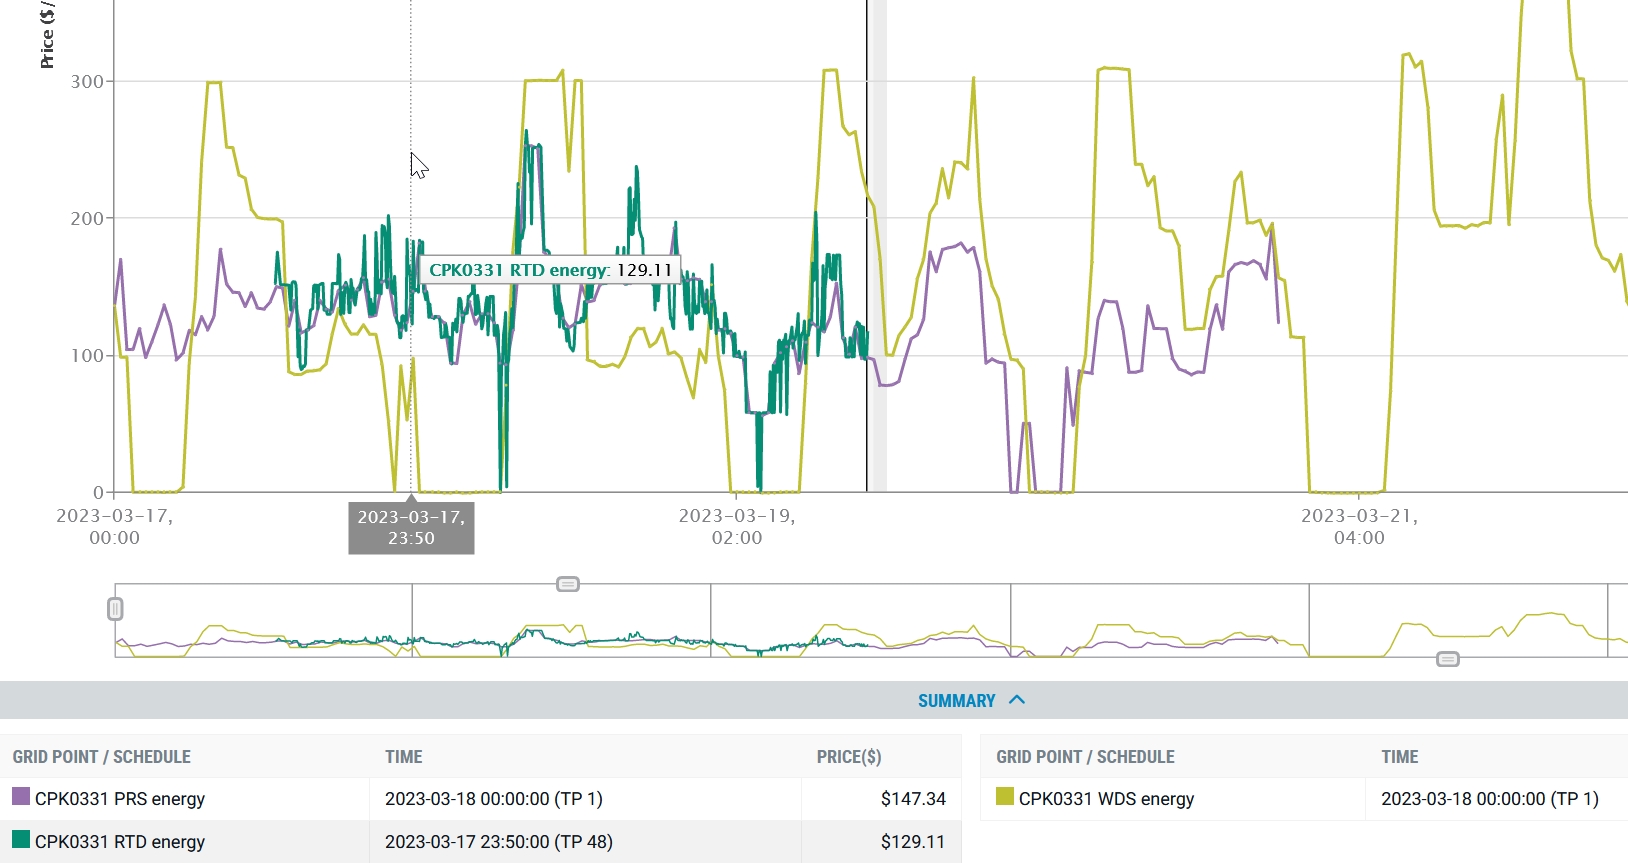
The WDS (dark Green) is calculated as a week estimate of what is to come. The PRS (Purple) is the pricing (on the Stock Exchange I think) and only forecasts part of the way out, and the RTD (Lime) is what actually happened.
By the look on the chart the lime tends to track the purple , so I’ll start with using that as the indicator of what I want to look at. Winding the start date back it looks like the price used tends to reflect the PRS purple line quite well, rather than the WDS weekly ones.
-From the API I should look to get the PRS (PRSL (published every two hours and contain data for trading periods 9 to 72 into the future) & PRSS (published every 30 minutes for the current and following 7 trading periods)) , WDS & RTD data and put them in a table to graph, maybe in Google Data Studio, so I can check each morning & evening power usage. I need to wait for access for getting Bearer Token key then I can automate this and put in DB.
Pricing information can be filtered in a variety of different ways. The minimum required parameters to filter data are a list of one or more schedules (market run types) and the market type being queried (either E for energy prices or R for reserve prices).
The R price I can get through API but not the E price. This may need further investigation.
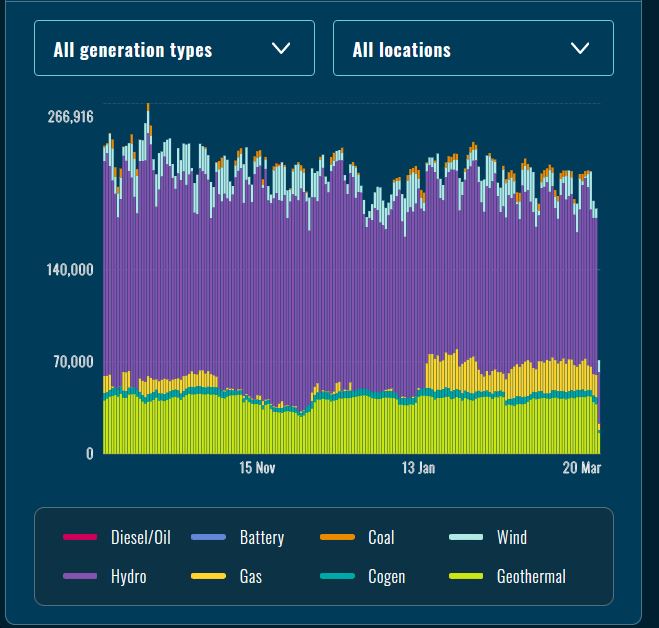
Energy Makeup and reserves
I found this website for Electricity Market Overview that shows where energy coming from.
Also there is the transpower dashboard on current situation
Also I’m requesting access for the hydro-power information at NZX Hydro. This may have indicators of Hydro capacity that may be useful in the predictive modelling.
And there is wind generation at NZ Wind Generation Association
As Geothermal is also part of the mix I may need to do a bit of a search on that too.
So I hope to be able to get a good set of resources to be able to get a better understanding of the electricity generation environment.
End Comment
It looks like I can get predictive tools with the API to view the upcoming planned demands , both from a weekly view and from sharemarket view to see what prices are anticipated in elation to loads to be able to plan my own limited strategy.
Currently I’ve got to logon to API site to get Bearer Token then use that in the script, but can now download data so I’ll need to setup DB tables to be able to store the information.
I think I want to call the data overnight and make a Google Data Studio dashboard with the peak periods highlighted – I’ll need to learn how to do that too.
I awoke this morning and checked WITS info and decided to make breakfast early so that I would not doing it in peak period. Also when I woke in night I put HWC on from 12.45am to 2.15am (just when I naturally woke in night) so maybe knowing when lowest periods are will allow me to turn on HWC at correct time.
Appendix- Price Types and explanation from Help page on WITS Dashboard site
Prices types:
- Dispatch (RTD) prices
- Forecast (or scheduled) prices
- Interim/Final (or published) prices
Dispatch (RTD) Prices
Dispatch prices are calculated for the current trading period at Grid Points – providing a snapshot of the market in real time. The prices normally arrive every 5 minutes and are calculated by Transpower as the System Operator.
A summary record accompanies each dispatch price run, the summary includes data used in the calculating of the relevant dispatch price.
Forecast Prices (NRSS, PRSS, NRSL, PRSL, WDS)
Forecast prices are calculated in conjunction with the Non-response schedule (NRS) and Price responsive schedule (PRS). For each of these schedules there is a short and a long schedule. The short schedules (NRSS, PRSS) are published every 30 minutes and contain data for the current and following 7 trading periods. The long schedules (NRSL, PRSL) are published every two hours and contain data for trading periods 9 to 72 into the future.
In WITS we merge the short and long schedules using the most current data available for each trading period.
Forecast prices incorporate:
- Energy and reserve, difference and nominated bids and offers entered into the market
- A load forecast as determined by the System Operator at conforming nodes.
Forecast prices are used for signalling prospective prices so generators and purchasers can plan their bidding and offering strategies to accommodate potential changes in the market.
The Week-ahead Dispatch Schedule (WDS) is run daily at 01:30am and covers all trading periods for the following day plus the next 5 trading days (i.e. 288 trading periods). The WDS is used to provide a week-ahead indication of planned outages and constraints.
Primarily the WDS provides outage and constraint information however along with this information forecast prices are provided.
Interim/Final Prices
Interim prices are calculated and published at the end of each trading period as the time weighted average of the dispatch prices for that trading period.
Final prices for all trading periods with no Pricing Error Claim are published by 14:00 the following business day.
Final prices are used for monthly settlement.