Python 2. Pandas for Data Frames for Housing Element manipulation
Working with large data sets in Excel is slow. So I wanted to see if I could use Python instead to wrangle the data.
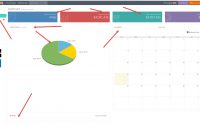
I wanted to use python to replicate some work I did using Excel and Knime. This was to adjust some pre-collected data from an Asset Database that was exported to a CSV file and set up the data so that I could show it on a map as per this Example.
In the example above I had simplified the data so that 1/ The data set was small, 2/Only a limited number of elements were shown (eg main roof , not gutters, fascia’s soffit, down-pipe and other ancillary roof elements)
I watched sendex’s Data Analysis with Python and Pandas video series to see that using Panda Data Frames was the best way to go.
I had 2 CSV files, one with all the elements of the properties data, and another one with lat/long coordinates of the properties.
The steps that I followed was to break the process down.
Part 1.
Clean the data and join the 2 data sets together. To do this I needed identical columns to join the 2 data sets on. For this I used the” Site Code” & the “Block Code” (there could be multiple buildings (blocks) on each site, so I needed to get the Lat/Longs relevant to each building). In one data set the site/block/unit/room code were all joined together, so I needed to split this into individual columns.
Once there were similar columns in both Data frames I could use a Join command (similar to SQL join) to link the lat/lon from one Data frame and merge it with the element data frame.
Part 2.
The conditions of building fabric elements were given at a specific point in time, in 2015, when the survey was carried out. There was the condition of the element, its baselife (and lower & upper baselifes (refer to this post for an understanding of different baselife’s of elements) and the remainder of life of the element at the time of survey.
I needed to calculate the actual condition year on year of each element so that you could see when the element was to fail and need replacing (for an example of this see this post that shows when elements get to condition 5 (needs replacing)).
Part 3.
Depending on the elements, external groups in this example, I wanted to offset the latitude by a specific increment to differentiate between External Doors, External Windows, External Walls & Roof and other external elements, then I want to offset Each of these Group Types by Substrate and finish ( Eg Roofing Iron & Paint finish to roof) as we will want to react to different durability issues of substrates and finishes ( Eg Roofing Iron will have a life of say 30 years & Paint finish to roof a life of 10 years, so we’ll need to do maintenance on the finish far more frequently than the substrate).
Part 1:
- Import the data from a CSV file into python and put it in a data frame (using the Pandas package) for the Element data
- Remove a lot of redundant columns
- Change data in rows in columns from NaN (not a number) to 0.
- Split a column into multiple columns that could define Site, Block, Unit & Room from a concatenated code column.
- Save to a CSV file ( as the deleted columns kept re-appearing, a crude method ut it worked )
- Import the data from a saved CSV file on line above
- Import the data from a CSV file into python and put it in a data frame (using the Pandas package) for the coordinate Lat/Long data
- Remove a lot of redundant columns
- Merge the 2 data frames into a 3rd data frame
- Remove a lot of redundant columns
- For some rows in the tables there was no element data so these needed to be deleted, so that the data was consistent.
- Save to a new CSV file. ( I wanted to stop at this point. So I created a new .py file for the next step)
Part 2.
- Import the data from a CSV file into python and put it in a data frame (using the Pandas package) for the CSV from end of part 1 above.
- Change data types of columns from strings to numbers, so that I could do calculations with these columns
- Work out from 2016 onwards, the remaining years left on an element, using the Baselife of the Element to count down from. When the Remaining years reaches 0 it needs to begin its countdown from the original Baselife ( eg Roofing Iron has a Baselife of 30 years. So if a survey shows roof condition C1 and remaining life of 20 years in 2015, then in 2016 remaining life of 19 years, then in 2017 remaining life of 18 years, and so on, until it reaches 0 years, then the next year starts again at 30 years, and the following year at 29 years etc). In the exercise years from 2016 to 2027
- Condition is graded from C1 to C5 where
- c1 >= .5
- c2 >= .33 & <.5
- c3>= .25 & <.33
- c4 >= .1) & <.25
- c5 is 1 to 3 years left
- So we can use the formula to find condition at any year of an element = remaining years/Baselife and look at the above table to see which condition is appropriate.
- So calculate the Condition each year using a conditional formula on the dataframe to calculate condition for years 2016 to 2027.
- Save to a new CSV file. ( I wanted to stop at this point. So I created a new .py file for the next step)
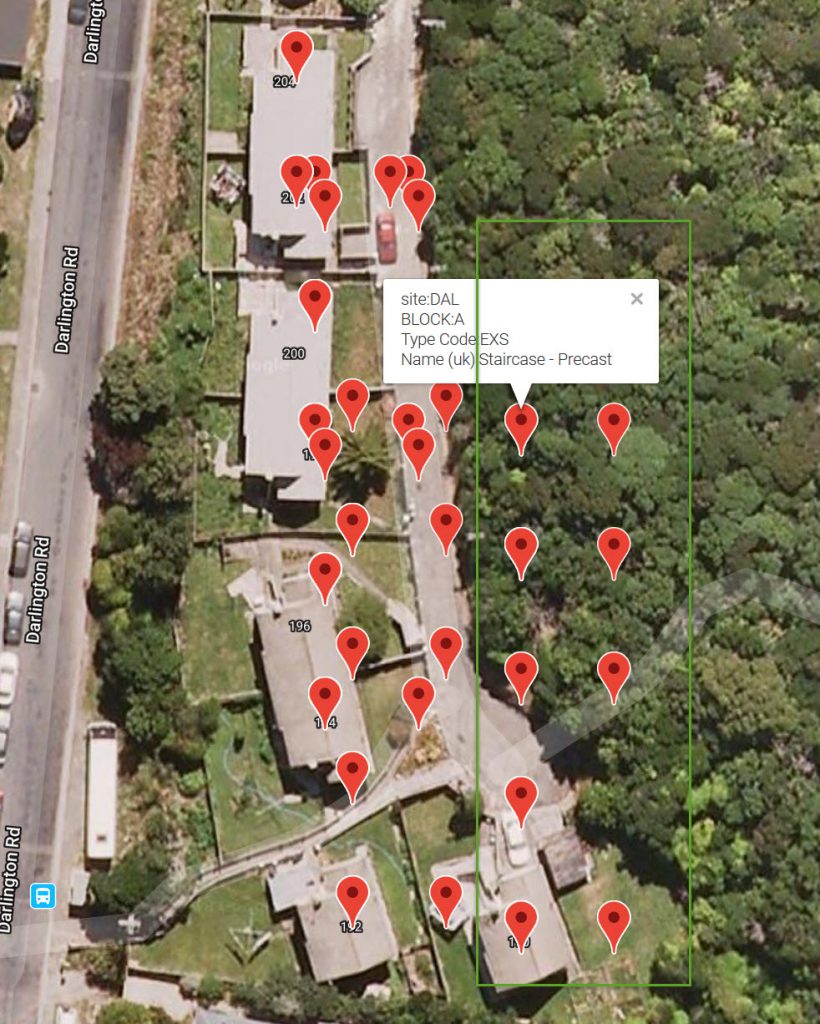
As a check I opened the CSV file and filtered it to only roofing elements of buildings ( further filtering out multiple roof elements such as downpipes, facias and soffits etc) and saved this to a test.csv file. I then used a CSV to GeoJson converter to convert this data set and plot it on a map. Zooming in on the markers they do mark the appropriate buildings.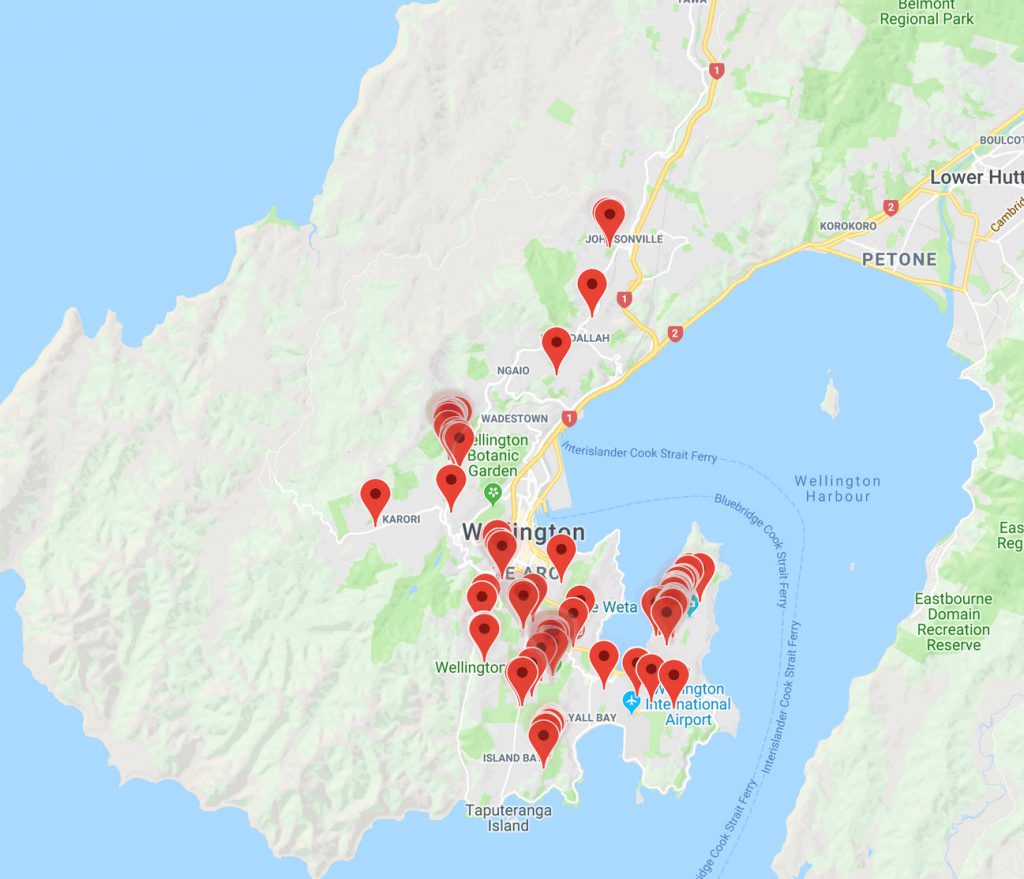
Part 3.
I have the full data set of internal and external elements. I need to strip the data down to only external elements
- Import the data from a CSV file into python and put it in a data frame (using the Pandas package) for the CSV from end of part 1 above.
- Filter data dfLatEx1=dfLat1[dfLat1[‘Group Code’].str.contains(‘EF’)]– filter by External Fabric (EF)
- Doors and windows are mixed together so I need to make 2 different Dataframes, one for all WND objects (that contain Doors and windows, and one for all other elements (Roofs, External Walls etc). Doors & one for window. Using the “~” tilda is equivalent to DOES NOT CONTAIN, a good way to split these data sets as you know you will get all the rows.
dfLatWND=dfLatEx1[dfLatEx1[‘Type Code’].str.contains(‘WND’)]
# Use “~” for DOES NOT CONTAIN!! cool
dfLatNoWND=dfLatEx1[~dfLatEx1[‘Type Code’].str.contains(‘WND’)]
- I then need to split the WND data frame into one for Doors & one for Windows. So repeat process above. I use filter .str.contains(‘Door|Finish’)] that contains words Door or Finish that captures all the door stuff. And use the “~” to capture windows that are not in door , this is a good method as there are Windows, Grilles & Louvres which would have needed other filtering to capture, the “~” resolved this much better.
# Split into Doors & Windows so seperate Dataframes.Need to Rename Doors ‘Type Code’ to ‘DOR’ then can join them together again
dfLatDR1=dfLatWND[dfLatWND[‘Name (uk)’].str.contains(‘Door|Finish’)]
# This is better than .str.contains(‘DWindows’) as there are some things in set (grilles) that are neither doors or windows (but classified as windows
dfLatWN1=dfLatWND[~dfLatWND[‘Name (uk)’].str.contains(‘Door|Finish’)]
- I then needed to change the Type code from WND to DOR to differentiate between the 2 . dfLatDR1[‘Type Code’]=’DOR’ # should this be ==???
- I then used the append command to re-join up all the data frames dfLatWNDMod=dfLatDR2.append(dfLatWN1) so that I had just one data frame again
- Then I saved to a CSV file ( I was getting a few errors but it was running the code. So I thought best to comment out the earlier work and start with a new CSV file
- IO then opened new CSV and split the data frame into different components such as walls, roof door and windows, so I could offset the Latitudes
# Split into different types
dfLat2DOR=dfLat2[dfLat2[‘Type Code’].str.contains(‘DOR’)] # this is at 0 (no change for lat)
dfLat2WND=dfLat2[dfLat2[‘Type Code’].str.contains(‘WND’)] # this is at 1
dfLat2EXW=dfLat2[dfLat2[‘Type Code’].str.contains(‘EXW’)] # this is at 2
dfLat2ROF=dfLat2[dfLat2[‘Type Code’].str.contains(‘ROF’)]# this is at 3
dfLat2EXS=dfLat2[dfLat2[‘Type Code’].str.contains(‘EXS’)]# this is at 4
dfLat2FLO=dfLat2[dfLat2[‘Type Code’].str.contains(‘FLO’)]# this is at 5
- Next I used an offset on each type for latitude (apart from Doors). I made a new column LatAdj and used If True, add increment to Lat Column by a specified amount, if False, then just make it the latitude. As all the sets are contained in the True statement, it offset them all.
dfLat2DOR[‘LatAdj’]=np.where(dfLat2DOR[‘Type Code’].str.contains(‘DOR’), dfLat2DOR[‘Lat’]+ 0.0, dfLat2DOR[‘Lat’])
dfLat2WND[‘LatAdj’]=np.where(dfLat2WND[‘Type Code’].str.contains(‘WND’), dfLat2WND[‘Lat’]+ 0.0001, dfLat2WND[‘Lat’])
dfLat2EXW[‘LatAdj’]=np.where(dfLat2EXW[‘Type Code’].str.contains(‘EXW’), dfLat2EXW[‘Lat’]+ 0.0002, dfLat2EXW[‘Lat’])
dfLat2ROF[‘LatAdj’]=np.where(dfLat2ROF[‘Type Code’].str.contains(‘ROF’), dfLat2ROF[‘Lat’]+ 0.0003, dfLat2ROF[‘Lat’])
dfLat2EXS[‘LatAdj’]=np.where(dfLat2EXS[‘Type Code’].str.contains(‘EXS’), dfLat2EXS[‘Lat’]+ 0.0004, dfLat2EXS[‘Lat’])
dfLat2FLO[‘LatAdj’]=np.where(dfLat2FLO[‘Type Code’].str.contains(‘FLO’), dfLat2FLO[‘Lat’]+ 0.0005, dfLat2FLO[‘Lat’])
- Next I used an offset on each type for FINISHES for Longitude . Again a new Column LngAdj and used the following
dfLat2DOR[‘LngAdj’]=np.where(dfLat2DOR[‘Name (uk)’].str.contains(‘Finish’), dfLat2DOR[‘Lng’]+ 0.0001, dfLat2DOR[‘Lng’])
dfLat2WND[‘LngAdj’]=np.where(dfLat2WND[‘Name (uk)’].str.contains(‘Finish’), dfLat2WND[‘Lng’]+ 0.0, dfLat2WND[‘Lng’])
dfLat2EXW[‘LngAdj’]=np.where(dfLat2EXW[‘Name (uk)’].str.contains(‘Finish’), dfLat2EXW[‘Lng’]+ 0.0001, dfLat2EXW[‘Lng’])
dfLat2ROF[‘LngAdj’]=np.where(dfLat2ROF[‘Name (uk)’].str.contains(‘Finish’), dfLat2ROF[‘Lng’]+ 0.0001, dfLat2ROF[‘Lng’])
dfLat2EXS[‘LngAdj’]=np.where(dfLat2EXS[‘Name (uk)’].str.contains(‘Finish’), dfLat2EXS[‘Lng’]+ 0.0001, dfLat2EXS[‘Lng’])
dfLat2FLO[‘LngAdj’]=np.where(dfLat2FLO[‘Name (uk)’].str.contains(‘Finish’), dfLat2FLO[‘Lng’]+ 0.0001, dfLat2FLO[‘Lng’])
- Next I appended all the different Data frames
- dfLat2All=dfLat2DOR.append(dfLat2WND)
dfLat2All=dfLat2All.append(dfLat2EXW)
dfLat2All=dfLat2All.append(dfLat2ROF)
dfLat2All=dfLat2All.append(dfLat2EXS)
dfLat2All=dfLat2All.append(dfLat2FLO) - And then exported to CSV to test with converting part of CSV to a geoJson file and plotting it to a map.
Which works fine. There is a bit of refinement on adding Marker Types and colours and actually plotting to a map. I will look at that in another exercise.
Files used for these 3 steps, they are not pretty but they worked. They are in Text file format. Just rename .txt to .py and they should be able to run.
Test CSV file with about 35 lines of Data
End Comment

StdLib API automation test with AirTable, SMS message, GMail & Google Sheets
Python for Data Analytics and other good stuff