Visual Asset Strategic Tools. Capture Building Information for Building Life Management. Open Source/Low Cost Technology Solutions for you to control your buildings
I came across this Dock in a YouTube video that I thought was quite fun. Circle Dock Circle Dock is a pop-up dock that you can add programmes and folders to. I have used shortcuts on the desktops for items I have on the task bar and then dragged them onto the wheel. They then
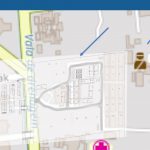
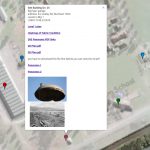
Something I used in one of my earlier exercises was layers on maps, on this post How to use Maps to find Data on Assets. It allows for using an online map such as Google Maps and putting information on that map with specific overlays. Follow the link for example (Note, if you click on
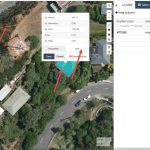
I’d come across this website and thought it was quite interesting. You could put polylines, lines and markers on the map and get the output in geoJson format. So this could be read with a bit of coding and displayed on a map on a website. I have just been having a wee tinker around
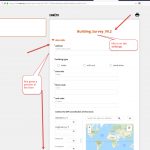
After trying and writing post about EpiCollect5 I decided to look at another data collection tool, Open Data Kit (ODK). A brief overview of it in video below: This has some strengths and weaknesses over EpiCollect5. Weaknesses: Only Android App, not Apple (but since there are lots of cheap Android mobiles this is not a
I had a couple of attempts at creating a mobile phone app for surveys. See this post and this one. I got distracted by the CRUD process and let it rest for a while. Whilst looking for some Python Mapping tools, I came across this article regarding capturing GPS data and was taken with the
This post follows on from Totally FREE Property Management Information Site (apart from your time) Part 1 Video (6.16Min) The main property plugin is this one: WP-Property-Property and Real Estate Management Plugin for WordPress. Create a directory of real estate / rental properties and integrate them into you WordPress CMS. There is a video on
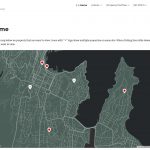
I have a Property Information Demonstration Site that can hold information on properties in a portfolio. Video ( 9.30Min) Being currently unemployed I have time to explore the AM/FM visualisation area that I am interested in. Tools that I use need to be either free or common. On WordPress sites I am always looking for
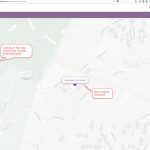
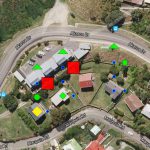
From How to visualise building condition changing over time I extended the asset base from just 3 buildings to many in this post How to visualise building data from databases. Now I would like to look at how to use Maps as a connector to link all your data together on assets so that you
Following on from How to visualise building condition changing over time I extended the asset base from just 3 buildings to many. So the JSON file store was not the method to use, instead I looked at storing the data in a Database, in this case a MySQL database. Video (7min). My first exploration was
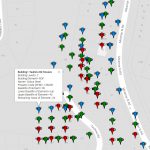
Here is a video (13 min) on a method to how to visualise multiple building elements condition changing over time. To explore the tool go HERE. The tool is based on using the Google Maps API with javascript coding that you can find HERE. The example is based on 3 buildings external elements: Has a