Python Analytics & My electricity Prices- Part 1
My electricity bill is broken down as follows:
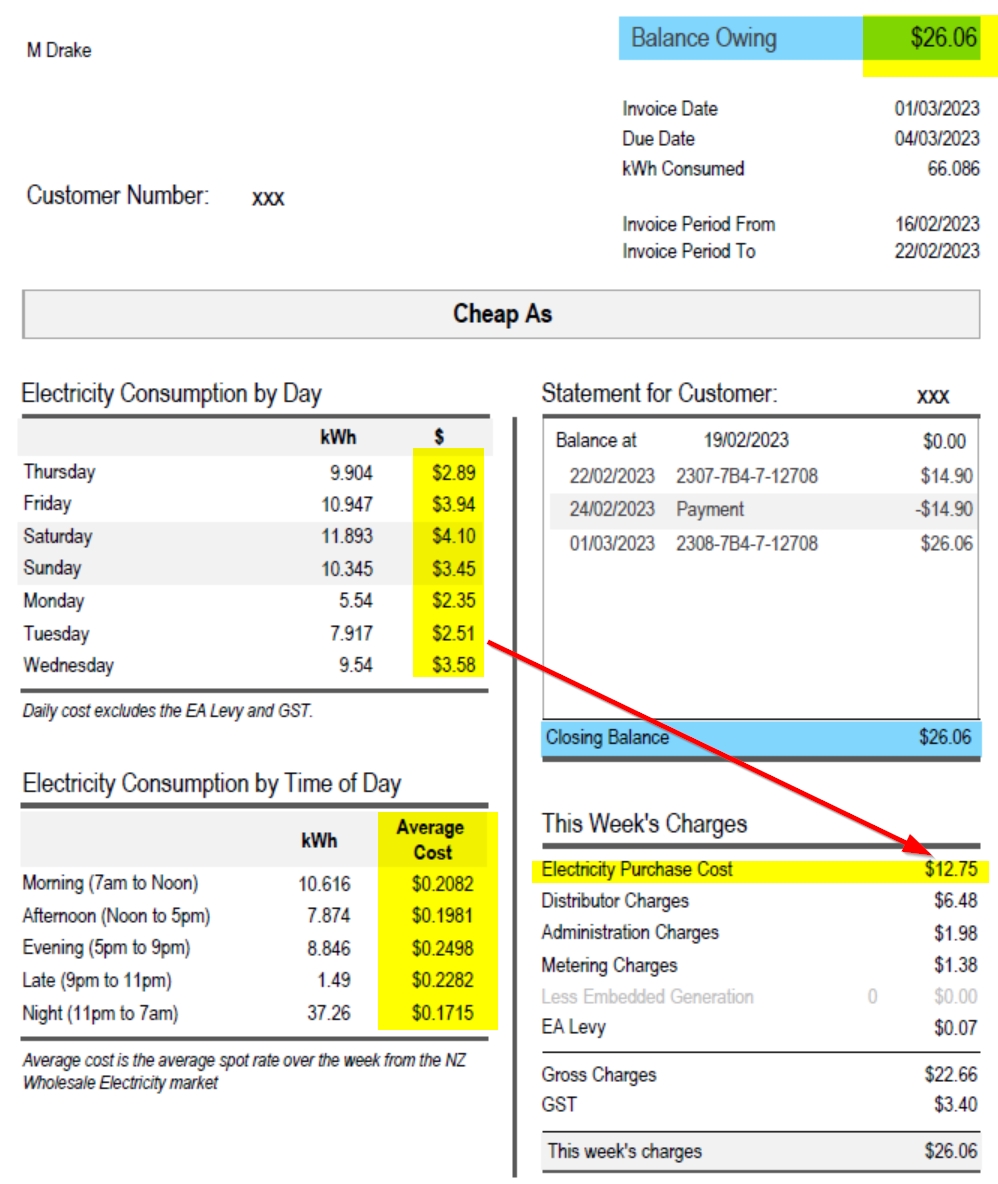
The actual Electricity purchase cost is usually just over 1/2 the actual bill, there are other charges such as “Distributor charges” that have a fixed component (minimum charge) and proportional component (based on kWH used) that is added to the bill for the final charge. So for the bill above the actual kWh charged is $12.75 and the total invoice is for $26.06
I have been gathering data from the bills for over a year in a spreadsheet:
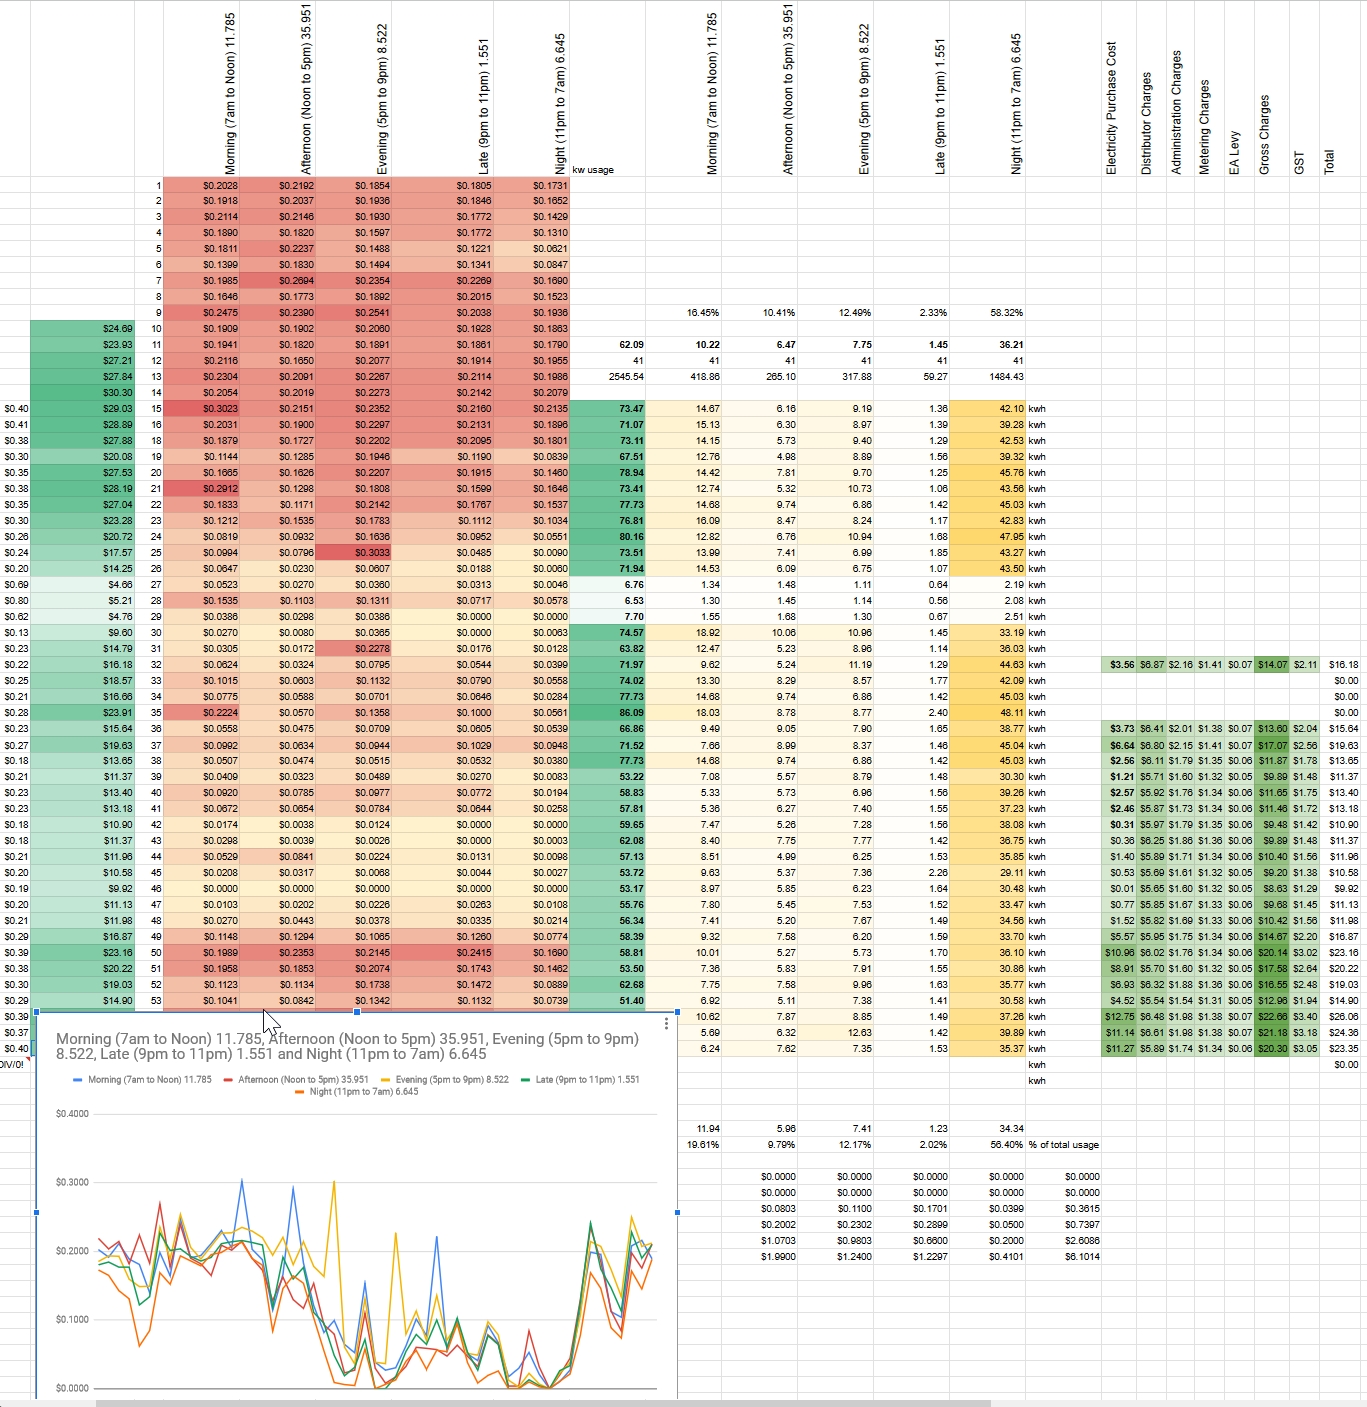
There are seasonal variations based on kWh charge rates through different periods of the day and through seasons based on rainfall and how full the Hydro dams are. So when they are full the charges are less.
The data I gathered was retrospective, in that it shows the history, but it is not necessarily useful for predicting whether the next bill will be higher or lower than the previous one.
I do have access to the historic Time series of spot pricing for price/MWh coming from the local substation at 1/2 hour intervals from the Electricity Authority (EA) as shown below that is up to the current time.
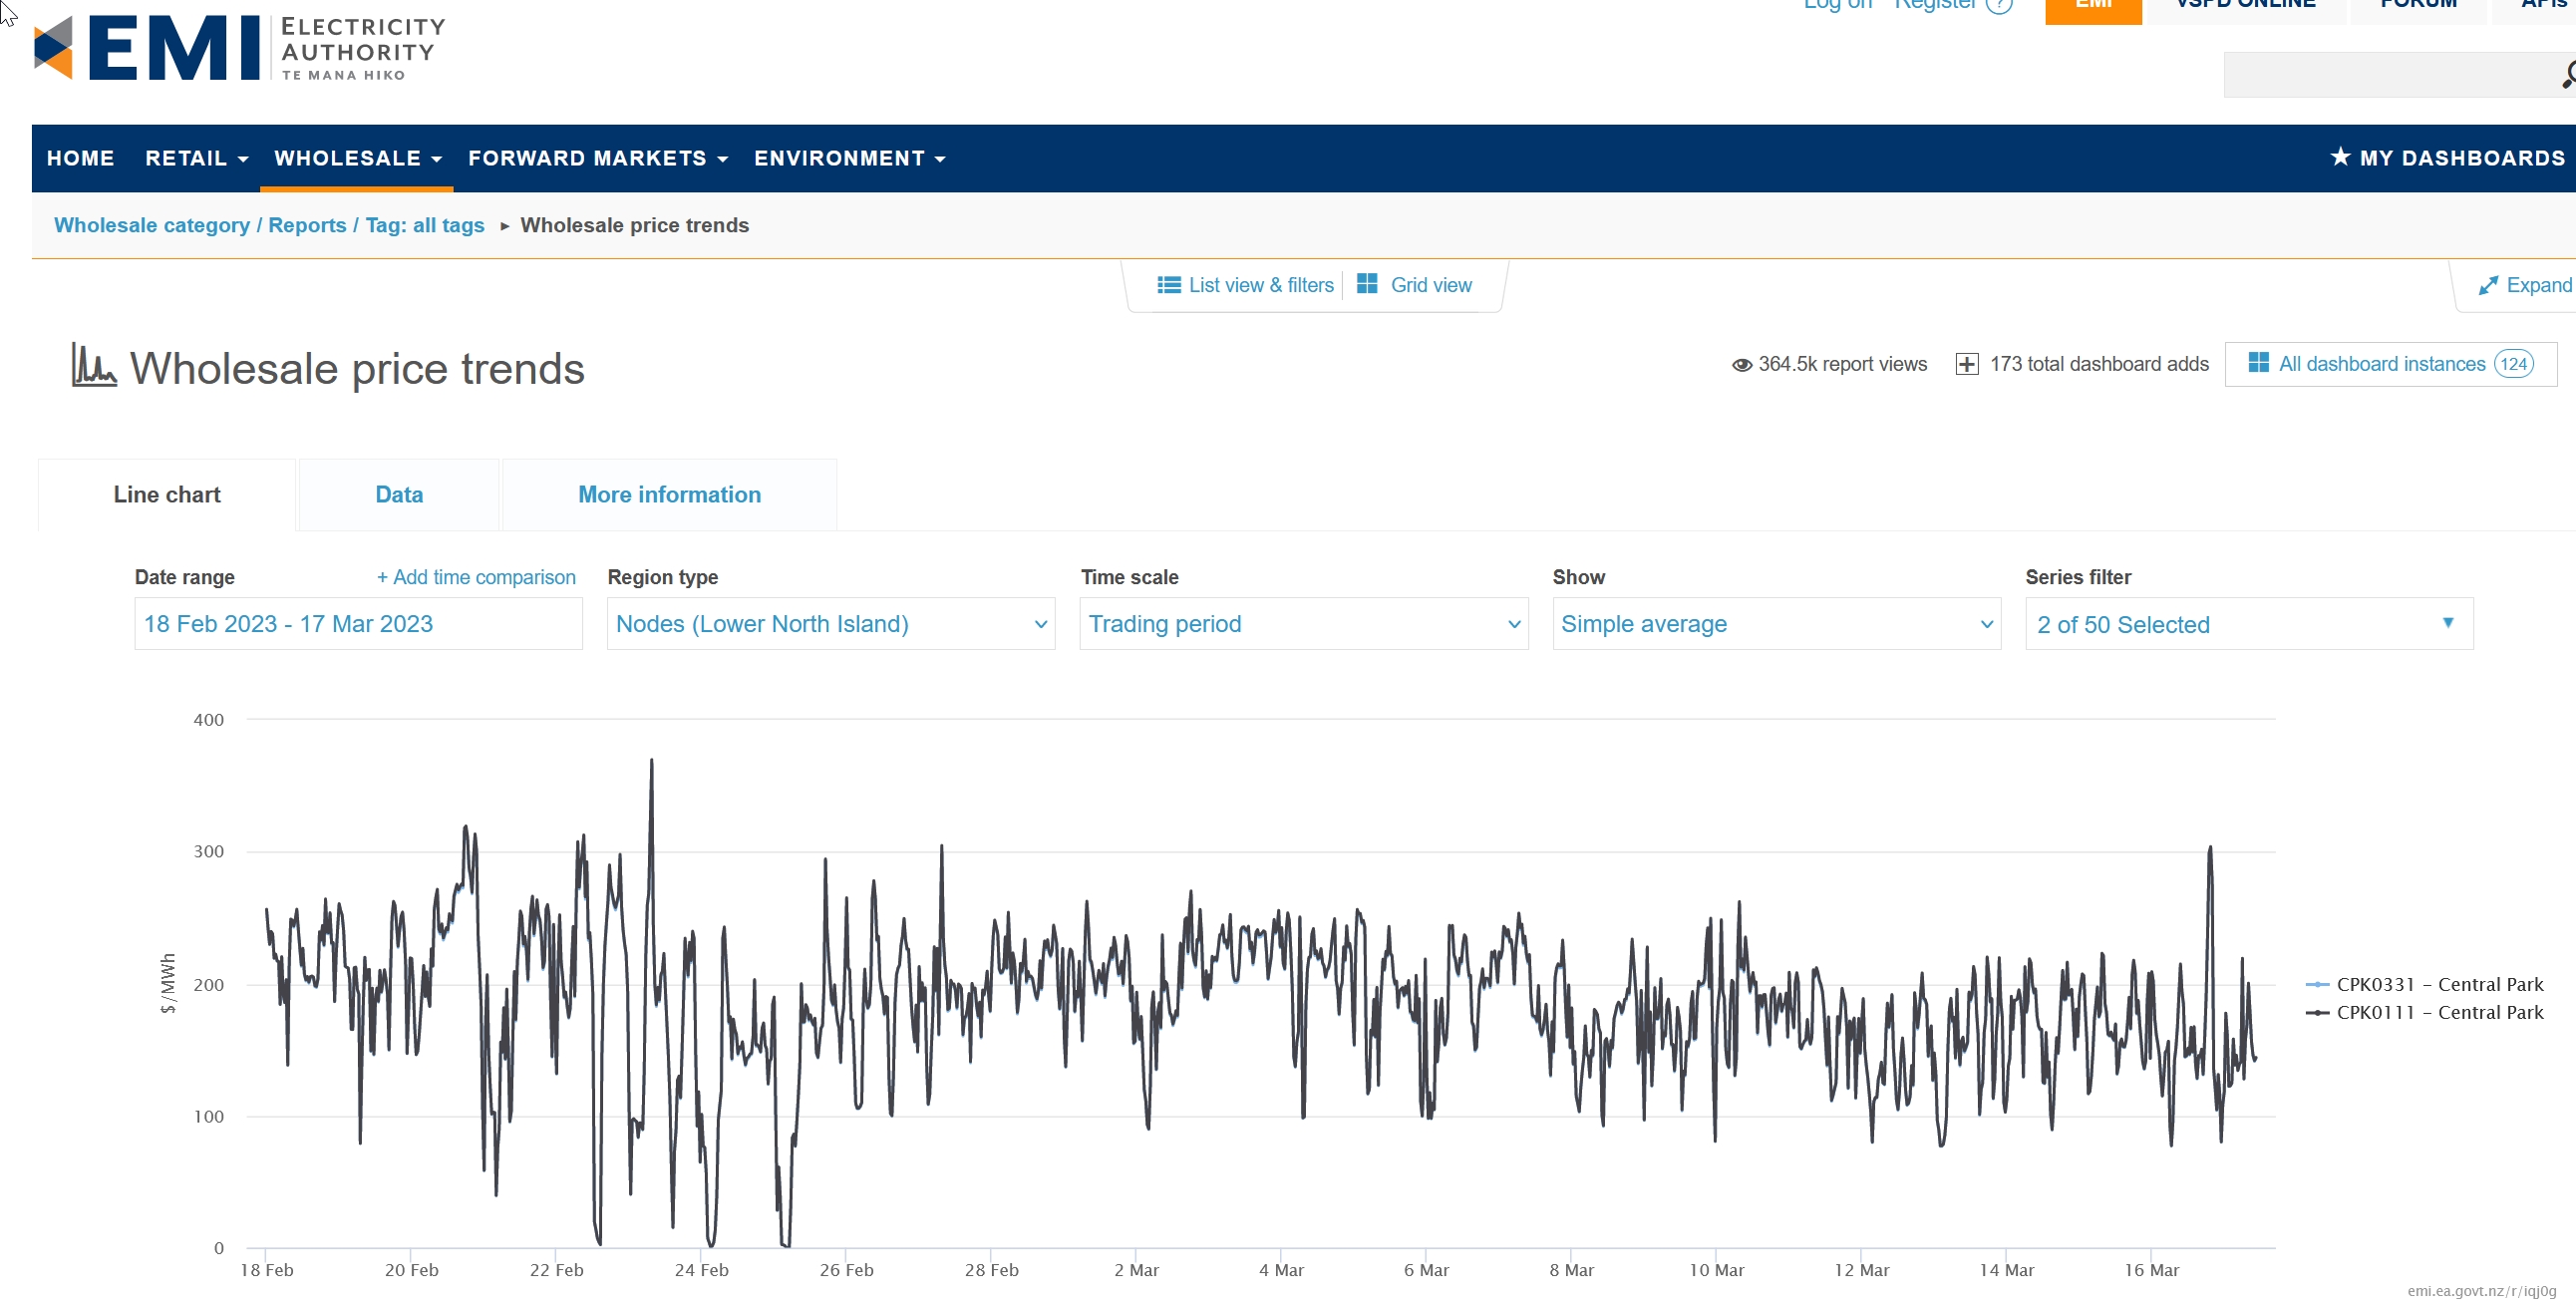
I am able to download the data, and use it to compare two weekly periods side by side.
My electricity bill is for my power usage the week before, so when I receive the bill, a week later, I’m able to download the data and compare the two periods.
In this way I can ascertain, using Python Pandas, whether my next bill will be higher or lower than the previous bill.
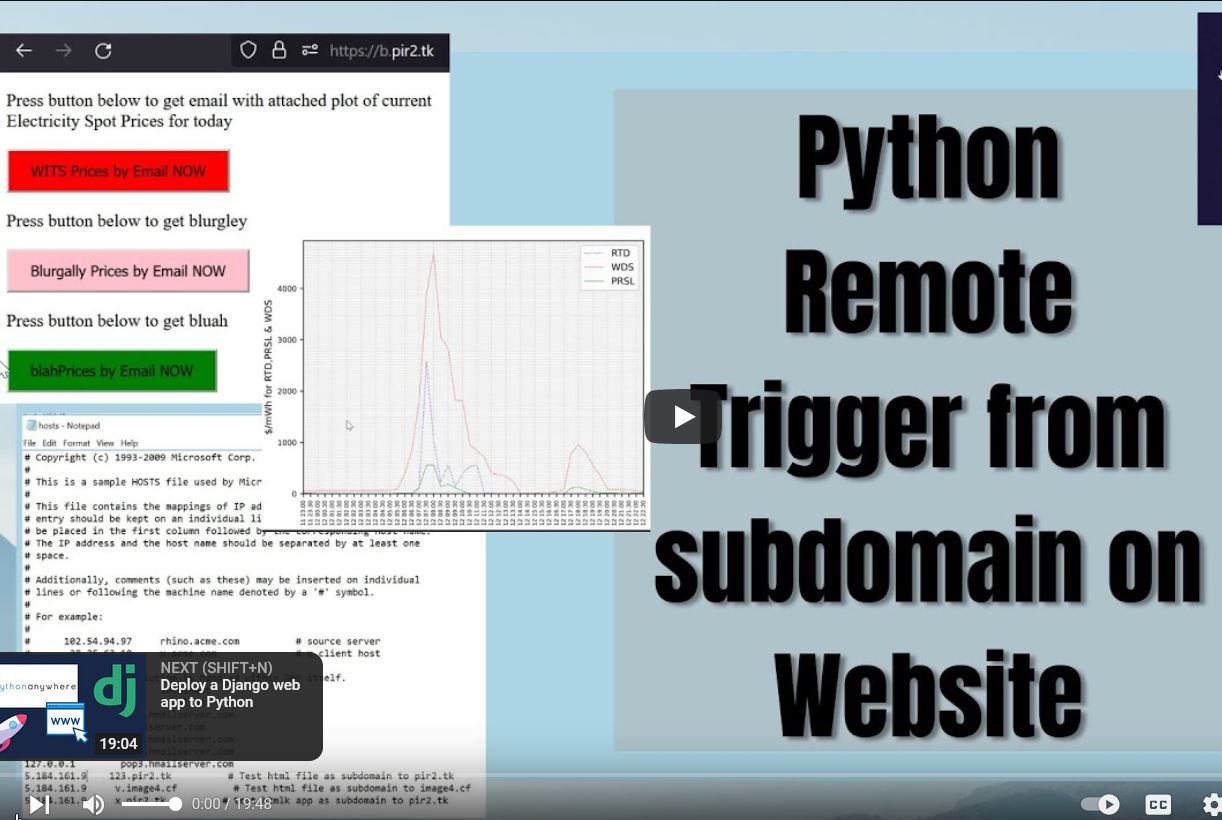
I did a video on the topic:
You can download the python script, some standard data and a pdf of the bill HERE.
In the video I discuss some other exercises that i can do with the data that may be of practical value, and i will discuss those items in the next post.
Gathered Data has changed my Electricity usage Behaviour
As there are variable charges based on time of day I realised that I would get more kWh if I could shift more of my usage to night time where the cost/kWh is mainly less than during the day.
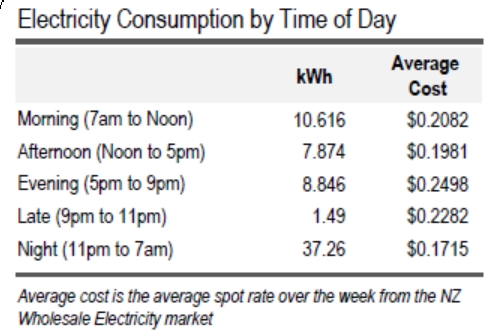
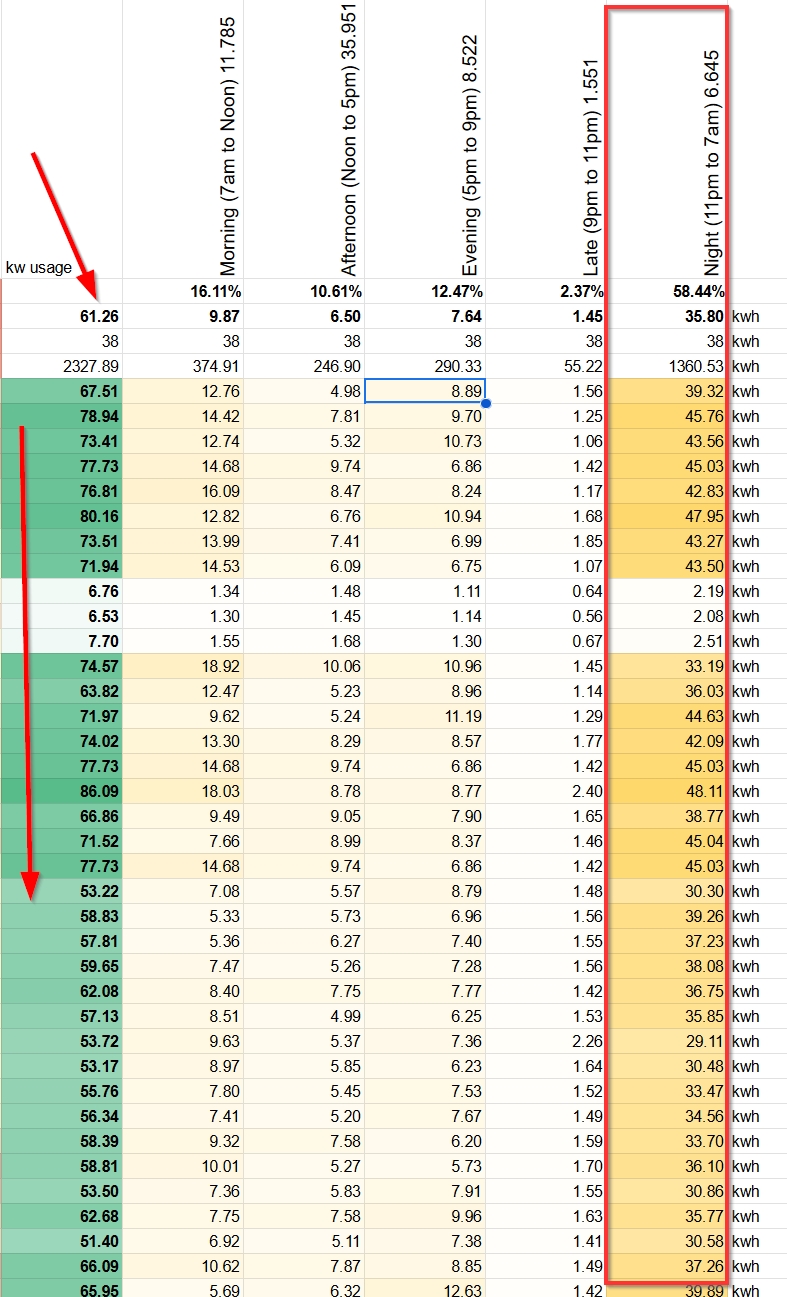
One of my major use of electricity is in heating my Hot Water Cylinder for showers and dish-washing, so I now turn it on at nighttime and off in the same period instead of leaving it running throughout the day. This means my major percentage of power use (average 58%) is in the nighttime period as shown in the table below.
End Comment
I was rapt (Kiwi Expression for very pleased) to be able to use Python Data Analytics to do something practical and useful for me personally, by being able to answer the question of ” IS MY NEXT BILL GOING TO BE GREATER OR LESS THAN THE CURRENT ONE”.
Based on the data available using the EA Wholesale price trends data I was able to predict a week forward from my previous bill, but no further.
In the next post I look at other information I may be able to derive from the EA Wholesale price trends data to see if it will allow me to reduce my electricity bill.