Honeycode Timesheet App – part 1
Welcome Early Bird All-Access Patron’s – An exclusive post for you
This is extra information about the video on “Honeycode Timesheet App – part 1” that is acvailable exclusively for you.
Big picture stuff first- Honeycode API
In my previous overview video I stated that the power of Honeycode would be when you connect into AWS environment.
Well, you can via an API interface:
The issue is you have to be on the Plus or Pro plans:
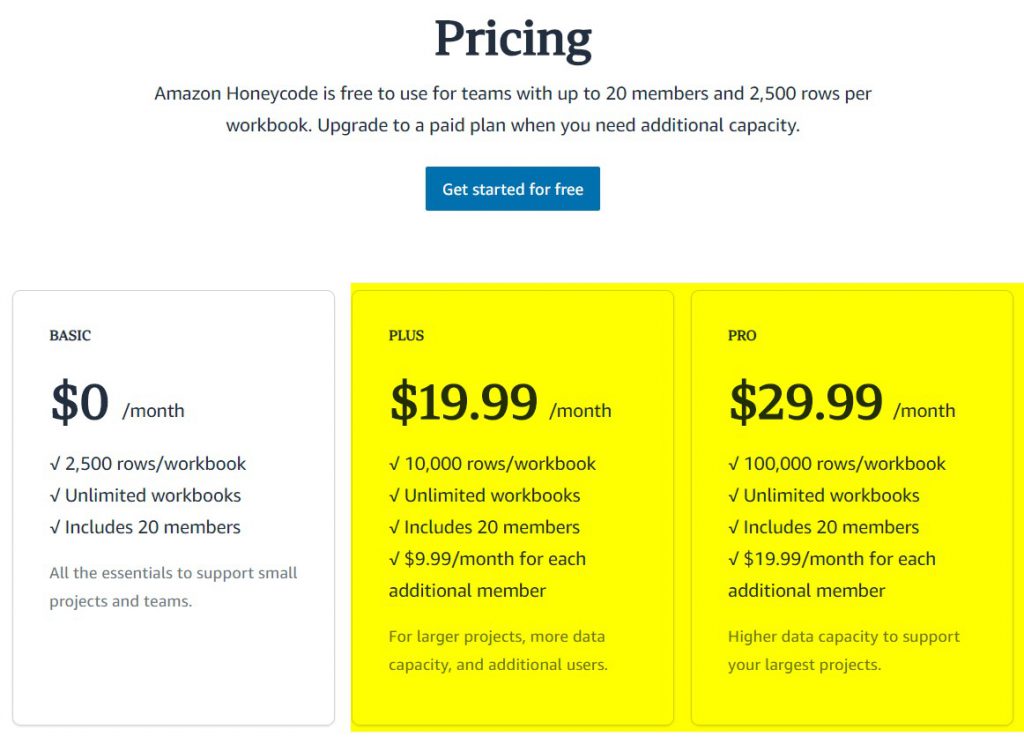
Which are a bit steep. So that is a setback. Although presumably only one of you needs to be on the plan to develop the apps and the other 19 in your team can benefit from them for free.
So that is exciting. But a real pain that you have no access via the freee tier to learn/play with it. If the Patreon support is sufficient I’d consider going onto it to build some powerful apps.
Honeycode Resources
While fossiking through the documentation I came across some spreadsheet Stuff:
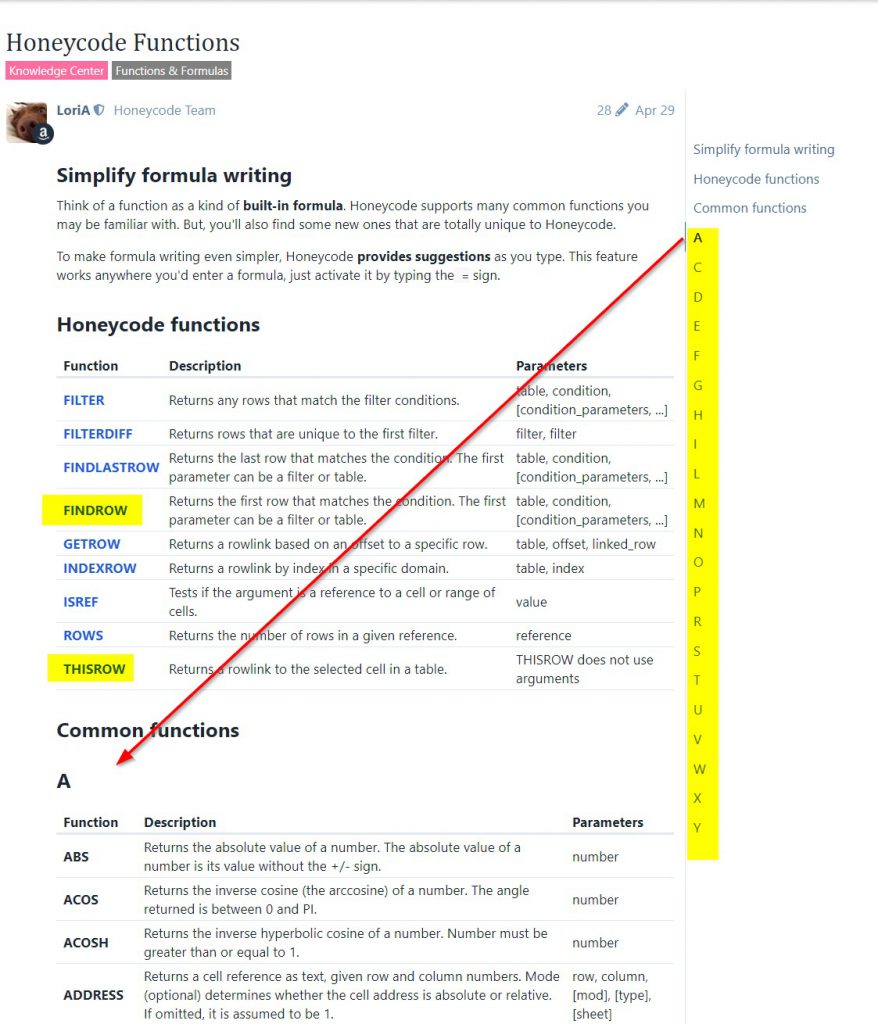
Honeycode Functions
This article has a list of functions, there are some that are unique to honeycode and a list, alphabetically, of other ones they use. I’d been looking for that resource earlier, so nice to find it.
Findrow & Vlookup
This is an interesting article on these two functions:
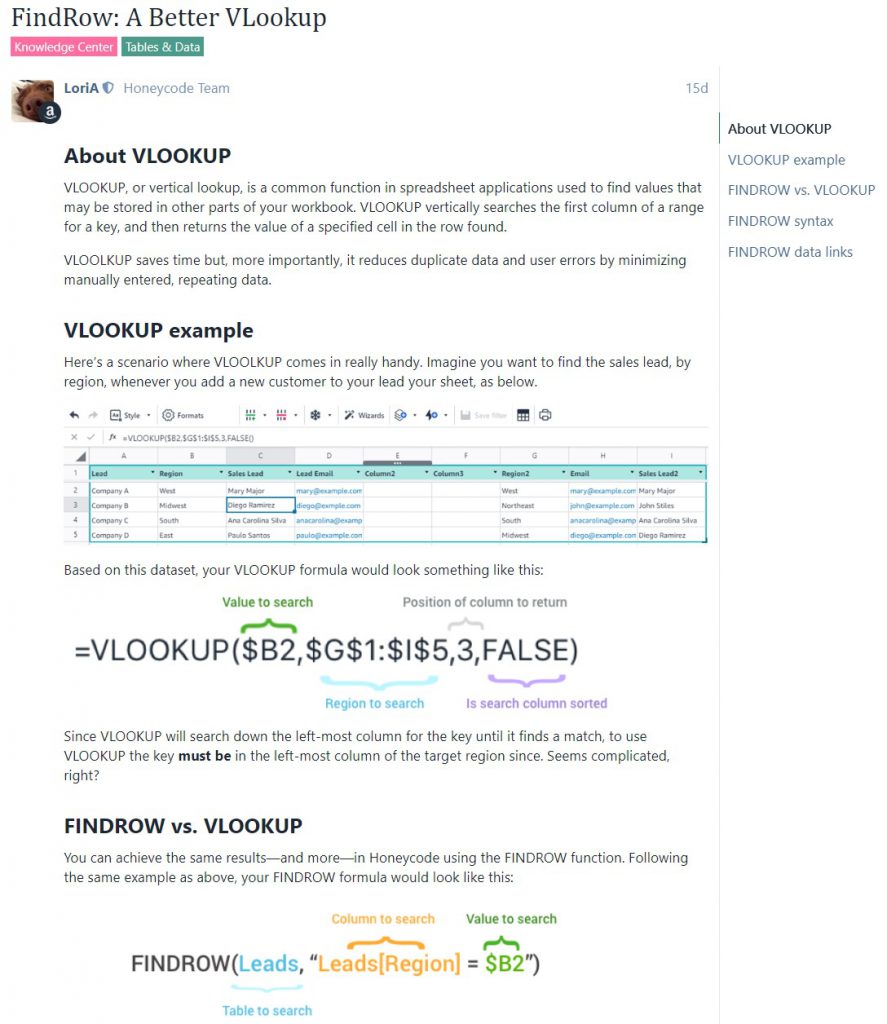
I did find it useful to pull data from one table across to another by looking up a cell.
How to add a picklist
This article sorted out my problem of #VALUE being displayed.
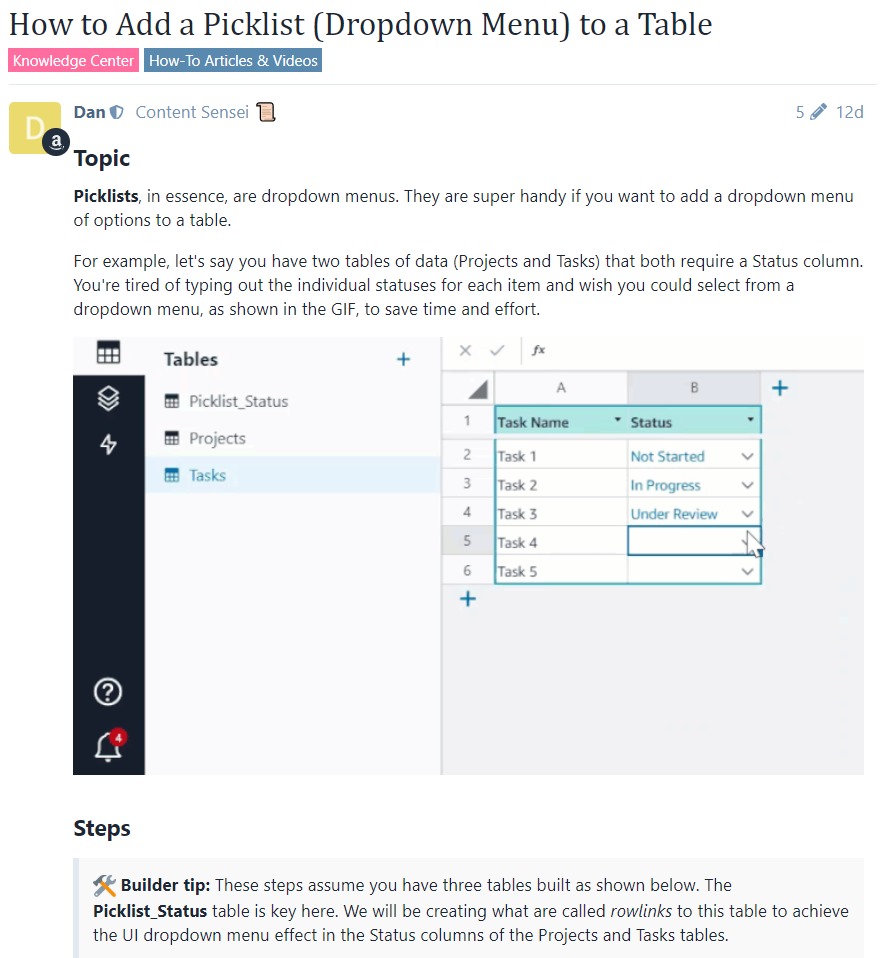
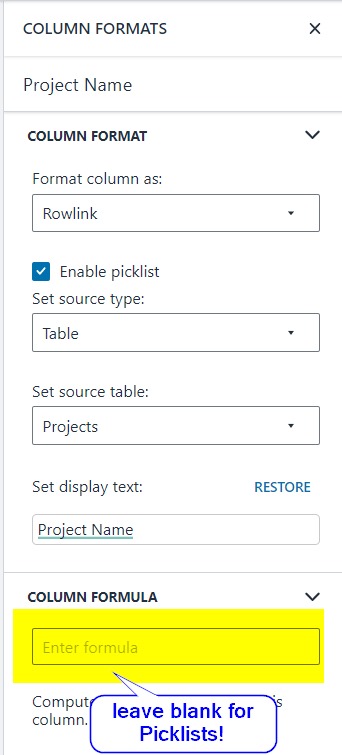
I was trying to put in COLUMN FORMULA for the picklists with the table formatting, and that did not work. You need to leave it blank (I wasted a hell of a lot of timewith that issue)
Timesheet project issue
A slow and frustrating day. I had been planning on using the Table to do the formatting and then using the App Wizard to build the app from the table. That plan did not work.
Main issue when I was trying to drive the app from the Table was that the formatting and COLUMN FORMULAE were not propagating correctly. I was getting a lot of data that was inputted into the forms that was not going into the Table. I rebuilt the app a number of times and made new tables but the issue persisted.
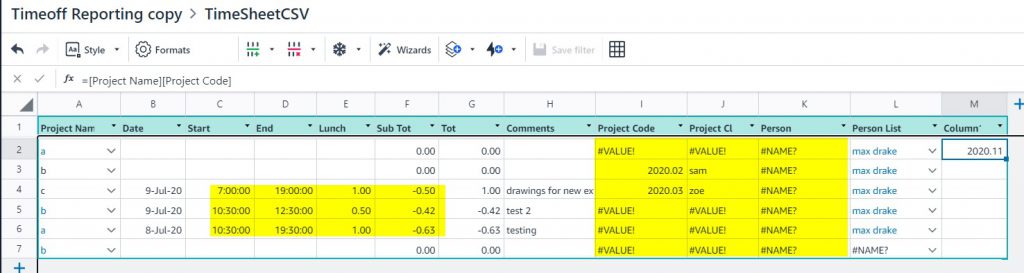
The other issue I had was the Project Name, linked to the Project Table was not showing on the INPUT FORM, even though you could pull down and select different items it still only showed #VALUE as per the images below

The issue was solved when I formatted the column correctly with the picklist method, as shown above, in linked article. Once I’d NOT filled in the COLUMN FORMULA it worked fine.
Breaking down the steps. Step , pushing data into Table from INPUT FORM
I have a tendancy to carry on repeating the same mistakes until I get a bit of distance to reflect on the procedure. So I went back to first principles, uploaded a new worksheet from a CSV file and did nothing with the TABLE and used the wizard to build the app.
At this point I focussed on getting a row of data into the Table. This is done by:
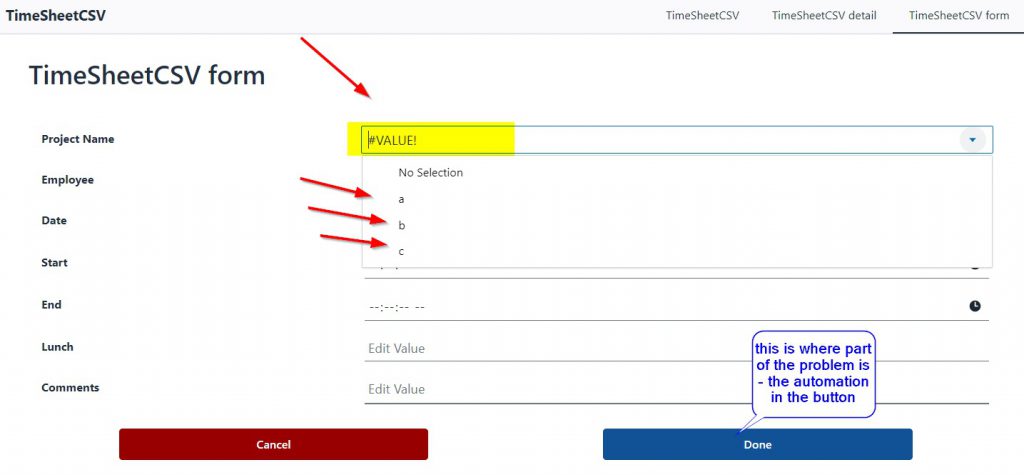
- Filling in the Input fields on the Input Form
- Pressing the Done Button,
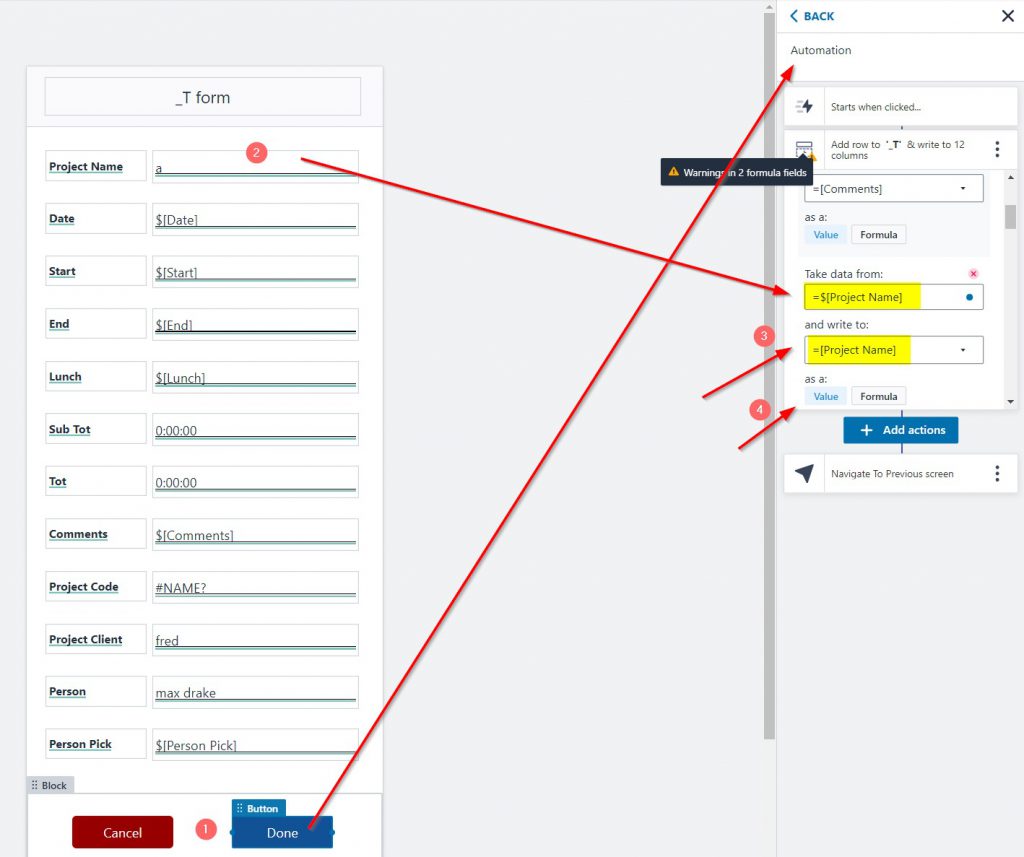
- This has an automation behind it and takes the variables in the Input fields and copies them to the Table column fields.
Where I was going wrong was not looking at the Automation process. I was trying to put the wrong data into the Table. Oops!
Variables versus Table Columns
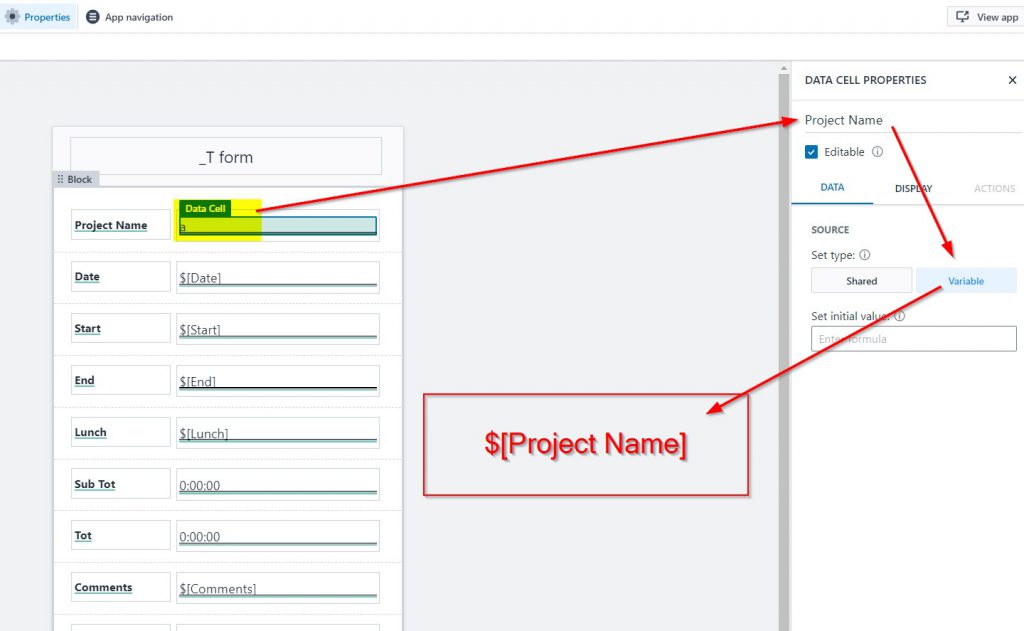
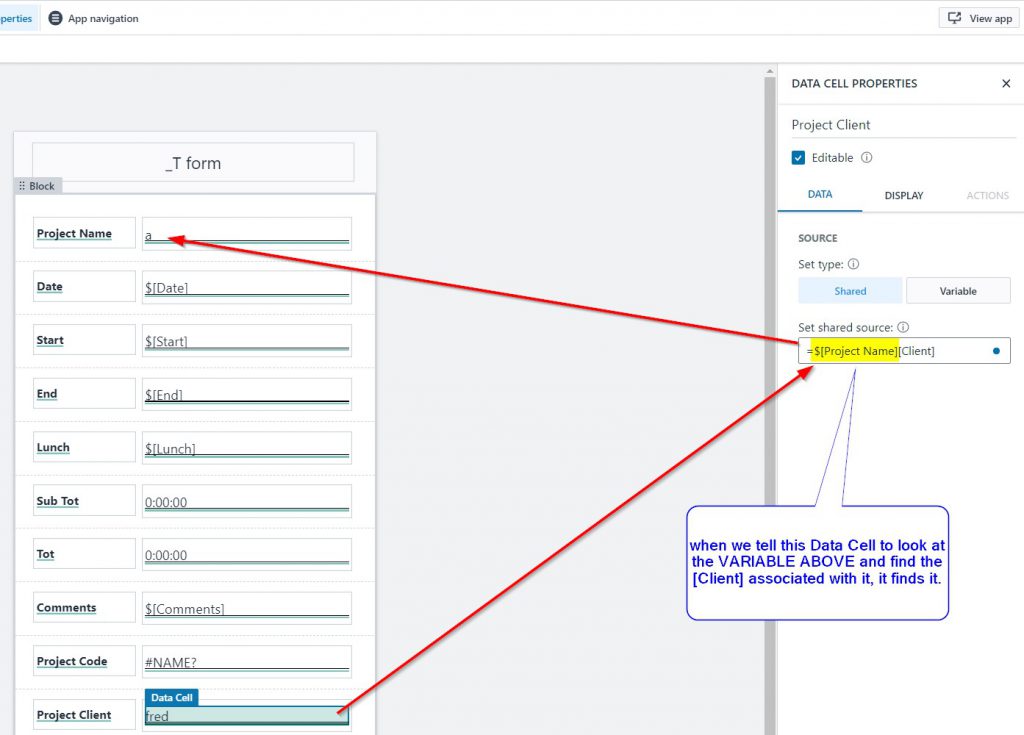
This is the issue that caused my confusion. The Data Cell object is a variable, it has the name Project Name, but to use that Data Cell as a Variable you call it by $[Project Name]. If you use [Project Name] without the $ then you are describing the column in the table instead.
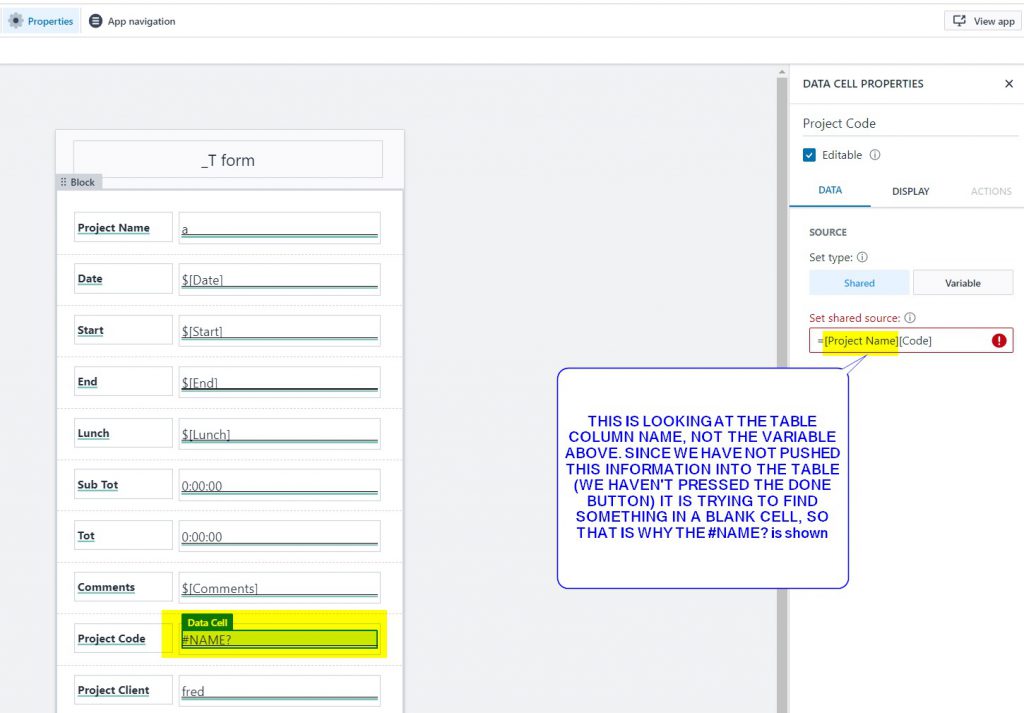
So when you use [Project Name][Code] it is referencing the Table column, not the Data Cell Variable, so of course you’ll get #NAME? as its comparing it with something that has not been created until you push the DONE button and copy the data from the form to the Table.
When you use the variable it works fine.
Then when you press the Done button, it takes the variable that you have inputted into the Data Cell field and copies it across to the Table Column as a Value ( in this case)
So that was a day’s work figuring that out, a bit slow of me. So I haven’t had time to focus on the time issue of getting the correct calculation for that.
Time & Duration
This had me mogodored for a while. Google Sheets uses a numberfrom a specific date, I think its seconds from that specific time, so you can use a formula to convert it into a specific date and time, so since its a simple number , for start/finish times you just subtract one number from another and then convert into a time or a duration.
I was messing around with formats, there are Date/times, Dates 7 Time where time is hh:mm:ss and for luch periods I just wanted to use a number, say 1 1/2 hours = 1.5, amd 1/4 hour = .25.
So how do you reconcile the two different formats?
You have to reduce to the common denominator, which is minutes in this case.
For start and end times find the hours and multiply them by 60 to convert to minutes. So for the End time, say 15:30, you can use the function =Hours([End]) * 60 to get the hour component of the time and turn that into mnutes.
You would then find the minutes of each =Minutes([End])
Then add =Hours([End]) * 60+Minutes([End]) to get the End time in minutes, then do the same for the start and subtract one from the other.
Thus you’ll have the interval between End and Start in minutes.
Then multiply the [Lunch]* 60 to get lunch in minutes , subtract that from the previous subtotal and you’ll have actual working time. Divide that by 60 to get the hours and fractional hours.
=(((HOUR([End])*60+MINUTE([End]))-(HOUR([Start])*60+MINUTE([Start])))-([Lunch]*60))/60
A bot of a tedious method , but it works.
Timesheet progress
At this point we have App & Data doing the following:
- Overall summary tab showing all timesheet inputs, by everyone who has the app. Currently I’m the only one using it so its all my data.
- Have delete tab if we want to remove a row of data
- Have an input tab that allows us to select a project and put time against that project in 2 ways. 1/ By Start time, End time and unch breaks(or total breaks) or 2. By just putting in a Total hour for a day on a specific project.
- So can work on multiple projects and book them in the timesheet on the same day.
- The row of data is inputted against the user ( this uses the $[SYS_USER] variable) that identifies who is logged into the app and inputting data (based on your login to the Honeycode app.
- All the people who have the app can put timesheet data into it. Everyone using this app cabn see everyone elses data, so this is the Manager App.
Where to next?
There are a few paths we can take from here:
- Filter to only show the logged in user’s timesheet information. The User App
- Chunk the information into manageable lumps, eg Duration, say filter to a start/end date, or by week, or month
- Filter by project and by start/end date
- Sum up hours to date within a specific timeframe, or do a running total of hours on the project.
End comment
I am finding that Honeycode is not that intuitive, I’m expecting the Table to act like a normal spreadsheet ( Excel /Google Sheets) but it doesn’t.
I thought I could drive the app from the Table, but that doesn’t seem to be the case. Maybe when I’m a bit more familiar with it I may be able to. I did spend an awful lot of time formatting columns and that seemed to disappear when you went back and re-looked at the Table column formatting. And it didn’t seem to propogate down the rows as they were created either.
There is a logic in there somewhere but I’m finding it hard to get to grips with. For the amount of time I’ve spent I’m quite disappointed with my progress.