Python3. Web data capture Part 1 with StatsNZ.API
I was looking at doing a project to test web scraping with Python. I came across this article from AIA about how many architects does the economy in the US need in the future. I found that a lot of the data used was from general government sources. So I thought I would look at getting data from NZ Statistics site to practice with capturing data from the web by API and web scraping.
I had initially seen how Python can connect to other data sources such as Quandl in the set of videos by sentdex. In the 3rd part of his Data Analysis series he shows how he connects to an API. I thought that was quite impressive, so I decided that I would attempt to do the same with NZ Statistics data.
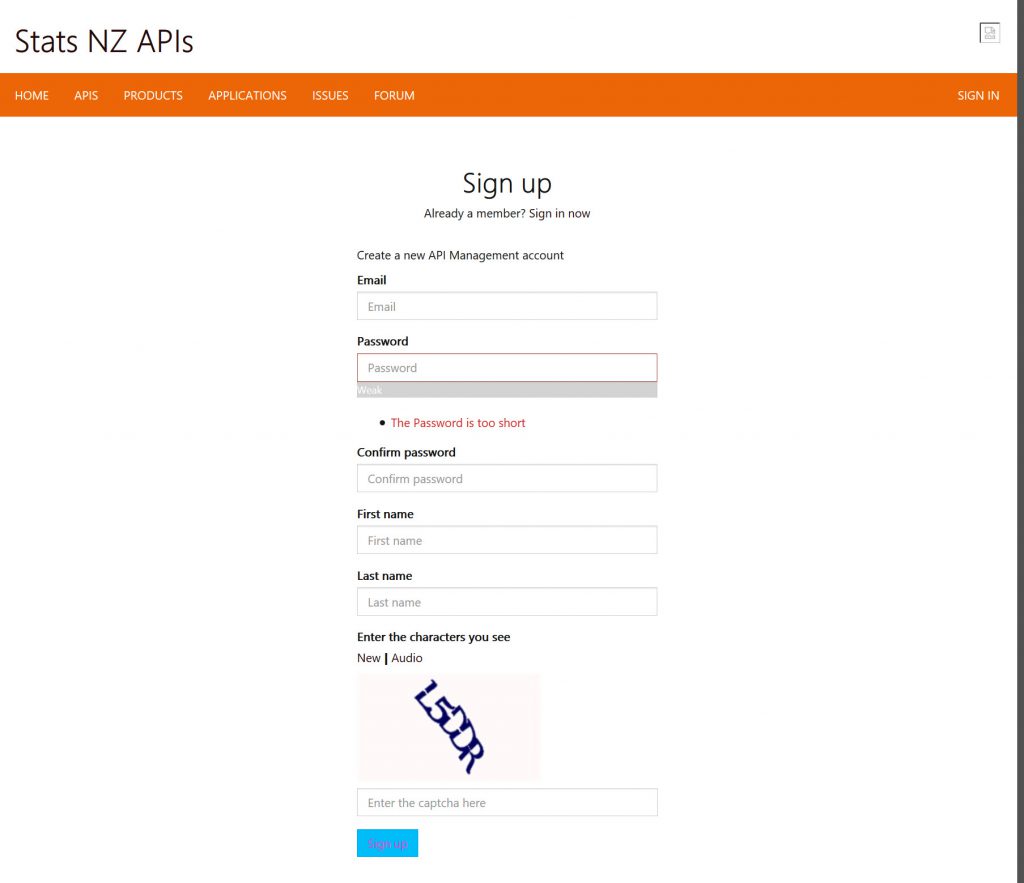
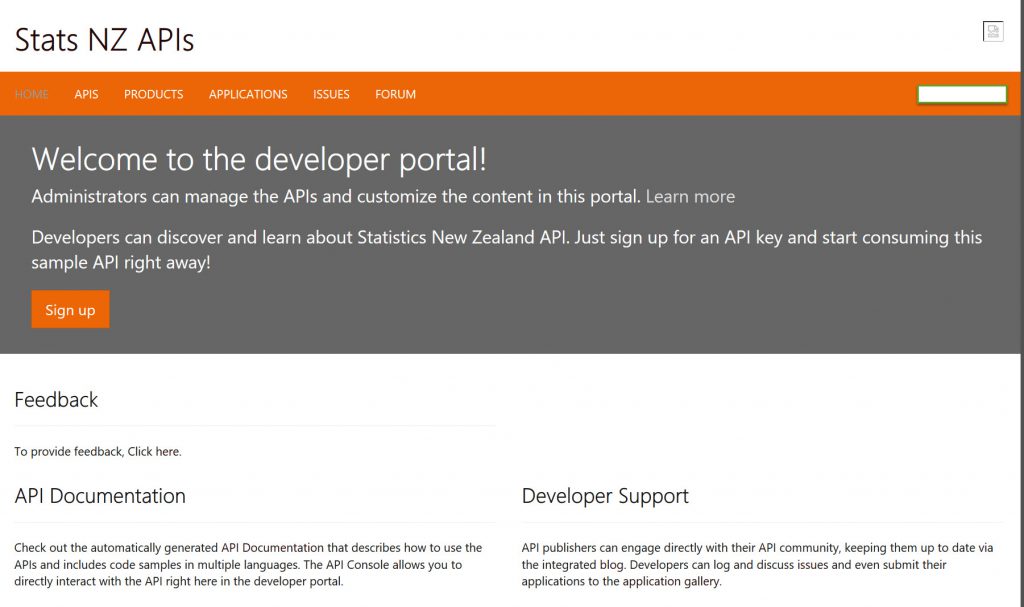
To get an API key from Stats NZ you need to create a free account here.
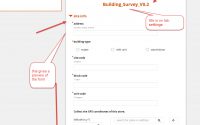
After setting up an account and logging in it creates
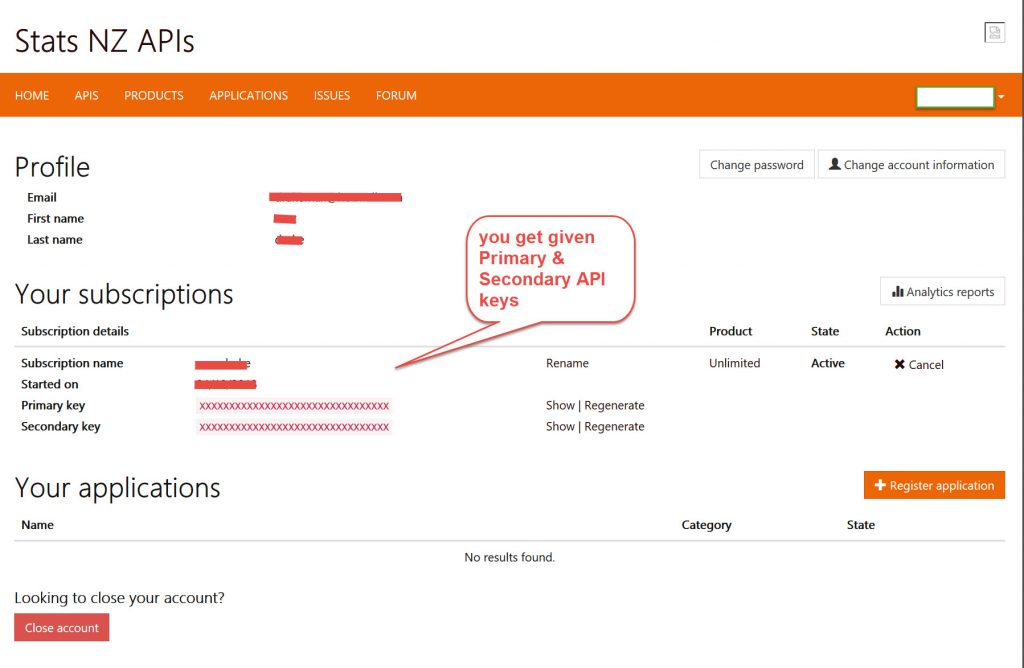
On your profile page (down chevron on right in top orange band) it shows you your personal setup and your API keys.
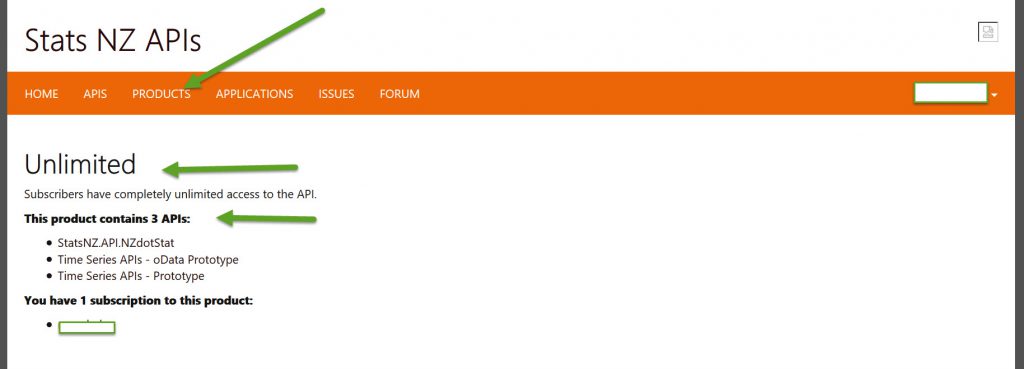
If you then choose the products that you want (I think I chose all for exploration purposes) -See below
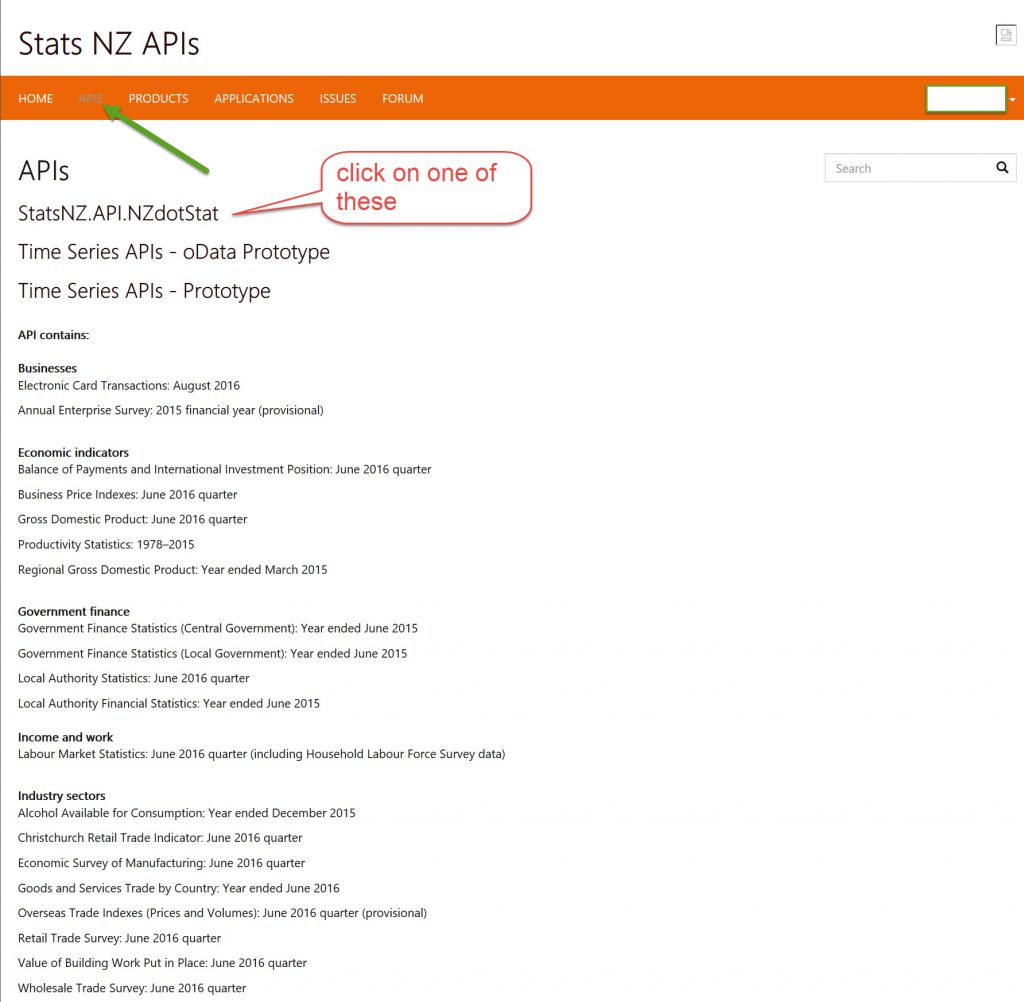
Then go into the API tab and select one of the API’s, in this case I have chosen the NZdotStat one
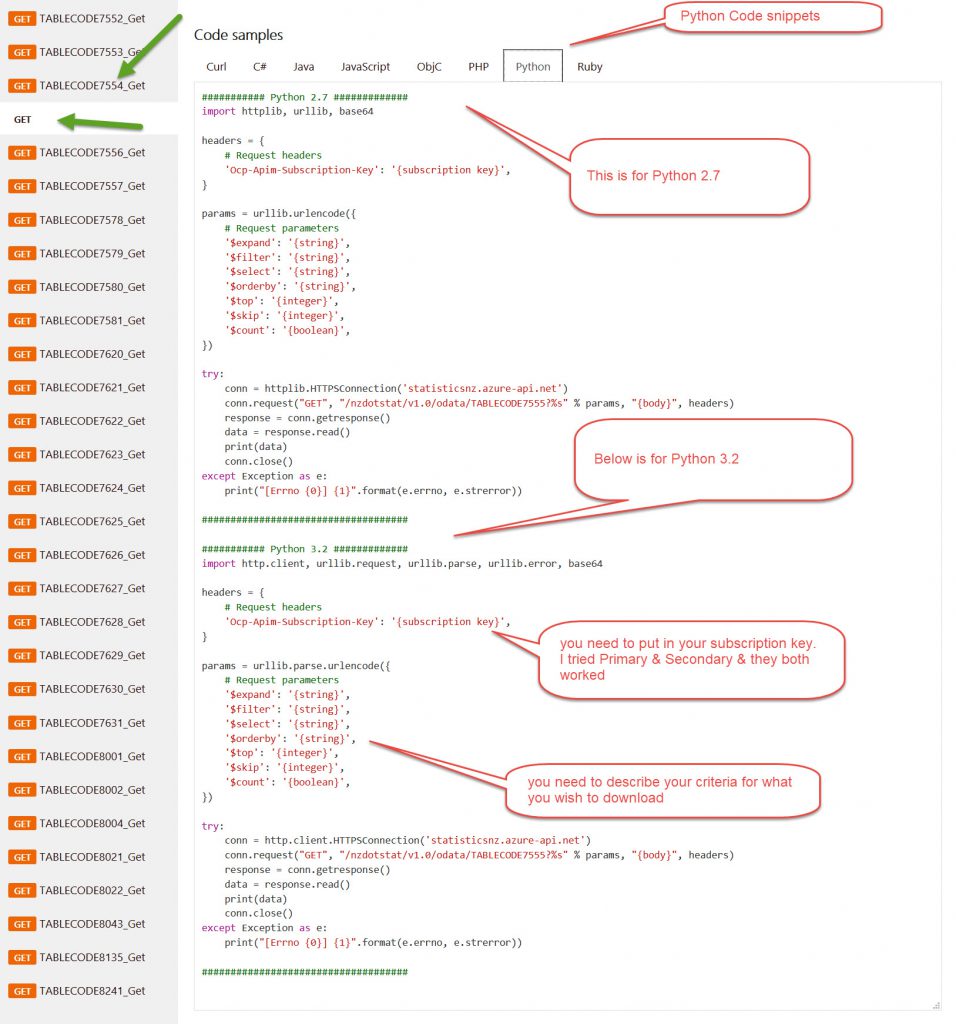
Then select one of the tables on the left and you’ll see that you are shown the request parameters that relate to that table data (doesn’t give you an example though!) and at the bottom the boiler plate code for different ways of calling with different programmes. I have selected Python.
Also note that there is a TRY IT button at the top too. We will discuss that shortly.
![]()
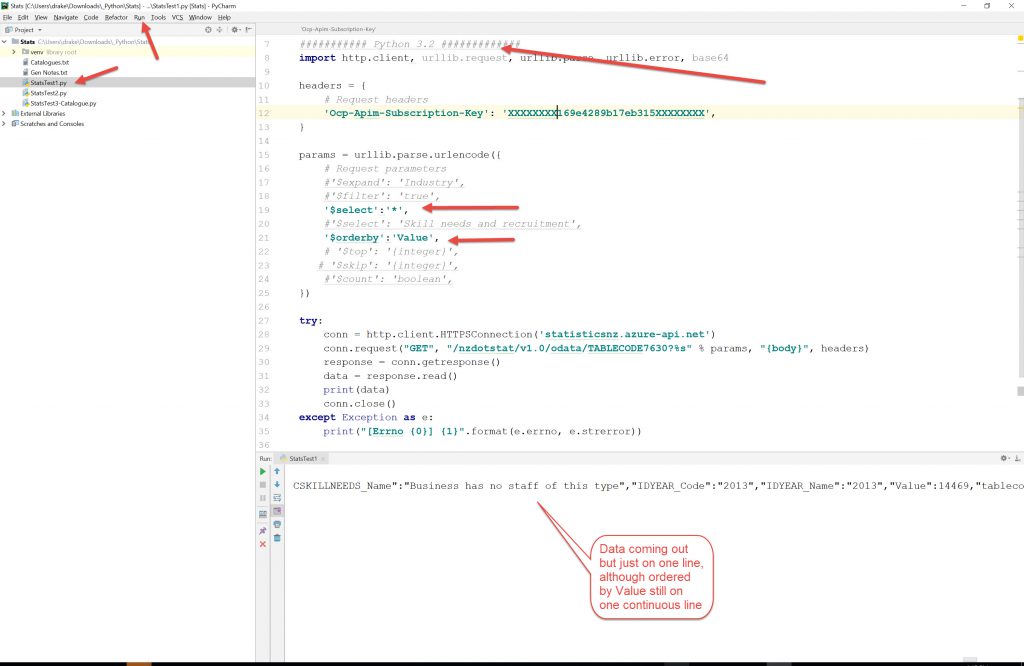
Now clicking on the python tab you will see that there is the boilerplate code for Python 2.7 at the top.
I initially thought that was all there was so cut/pasted it into PyCharm and got lots of ERRORS as the urllib package is urllib3 for the Python 3.6 version I have installed.
It was only late that I saw that there was the code below for Python 3.2 (which works fine in my Python 3.6 setup). So I cut/pasted the bottom part (the Python 3.2 code) into PyCharm to test it and still got errors as I had not filled in the Request parameters!
So I tried to figure out what the headers were in the tables so that I could select some.
It doesn’t tell you anywhere on the API part of the site where you’d get that information from, so that slowed me down too.The first table on this page is the catalogue page, and I used ‘*’ [wildcard ‘all’] in the select statement (and commented out all the rest of the Request parameters) and ran that to find the identities of all of the tables. I did this using the TRY button.
It scripts the Request with a URL link and a GET request and when you press send
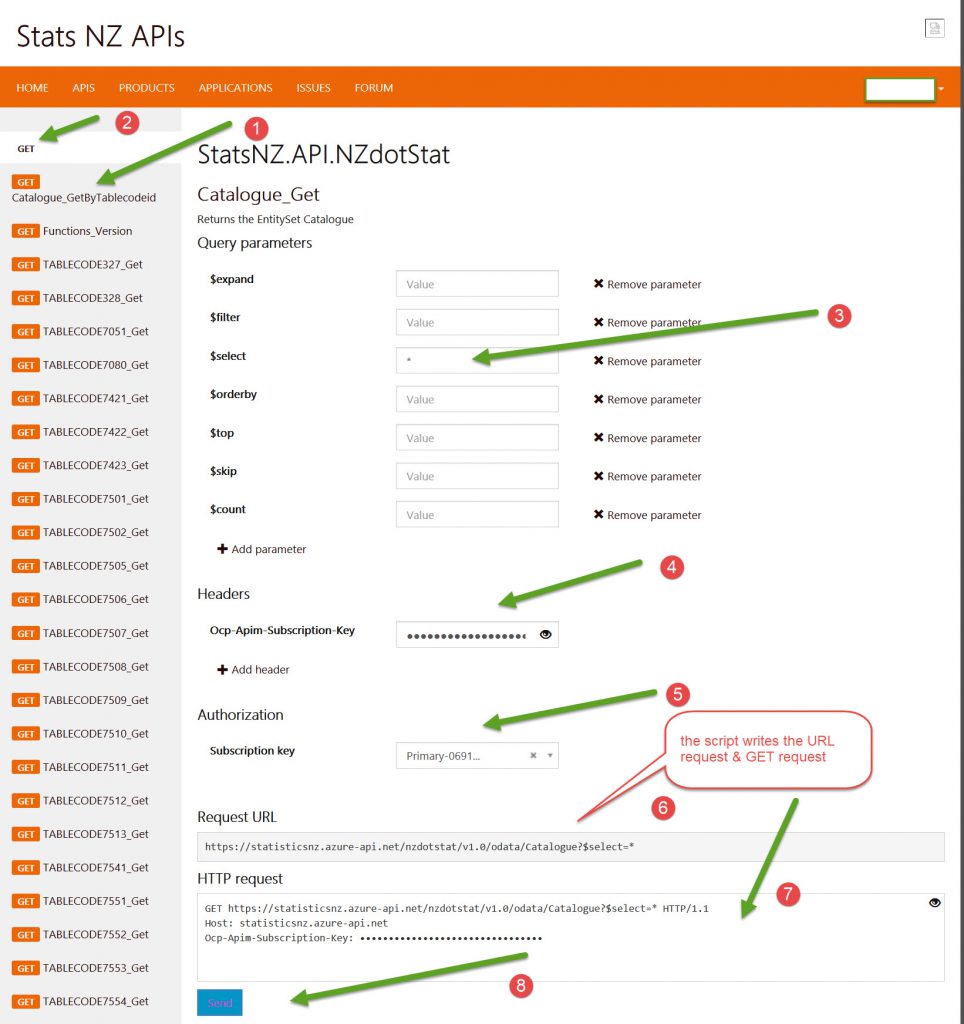
It scripts the Request with a URL link and a GET request and when you press send you get the results below
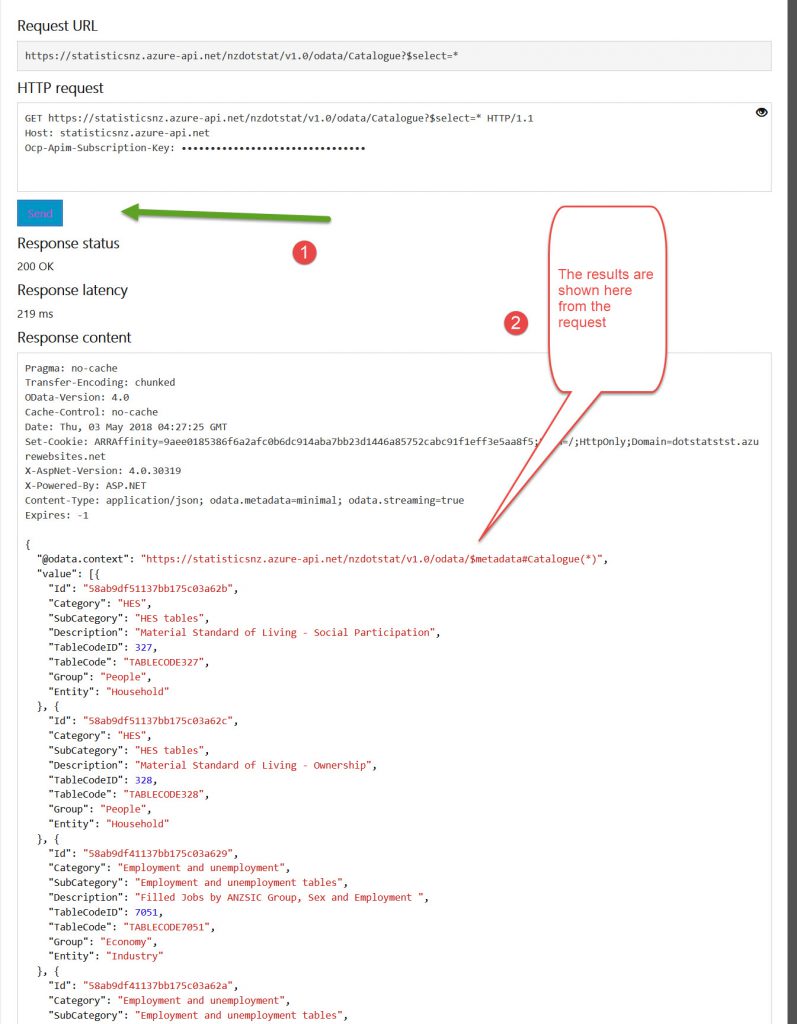
From here I could ascertain what the tables were about and do a search on the Statistics website, which in turn opened up spreadsheets in my browser as below.
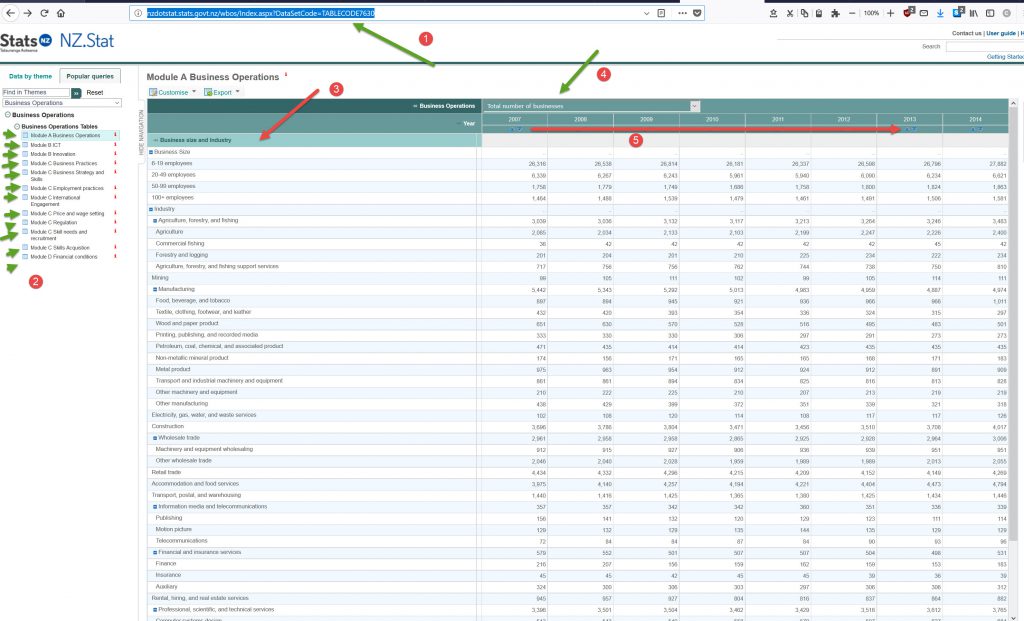
Item 1. The browser address, in this case it is:
http://nzdotstat.stats.govt.nz/wbos/Index.aspx?DataSetCode=TABLECODE7630
and as you can see the TABLECODE at the end relates to the tablecodes of the API. Hurray!!!! (Up to a point).
So at least I can look at the table data by putting in a Tablecode into the URL to be able to look at the data.
Unfortunately, I think the data being displayed are pivot tables. All the modules on the left hand side (item 2, lots of green arrows) shows the data in different ways and displays different datasets. I am still trying to get my head around Pivot Tables.
I still haven’t quite figured out how to call this data in any meaningful way as:
- There seems to be different modules (item 2- lots of arrows)
- There are different descriptors for the rows (item 3)
- There are different selection criteria (item 4)
- There are different dates/years (item 5)
So how these are combined to make meaningful queries I am still trying to figure out.
So, at the end of the day, I have downloaded data using a Python file from Stats NZ via its API. That is a partial win.
I now have to get the data I want to choose by improving the queries and also have it in a format that I can use it in.
I’m not sure if I need Python package Panda’s at this time or Beautiful Soup.
There will be a part 2 of this exercise.
Another exercise I need to do is to try to scrape this data from the spreadsheet page directly using the the Beautiful Soup package.

Starting with npm and React JS
Beginning SEO with Yoast plugin